A fan curve can help you select equipment only when you know what was measured, for which fan, and under which test boundary. The title of a standard on a brochure is a starting question, not a substitute for a report. This guide follows the evidence chain from a visible test setup through measured points to a published curve, then separates a test method from a certified rating.
The video illustrates the testing workflow. The LONGWELL facility photograph below gives physical context. Neither the footage nor the photograph, by itself, proves that a particular model met a performance point, that the laboratory is accredited, or that the model carries an AMCA Certified Ratings Program license. Ask for the current record tied to the complete model and revision before using a curve in an approval decision.
What the test-facility photograph can show
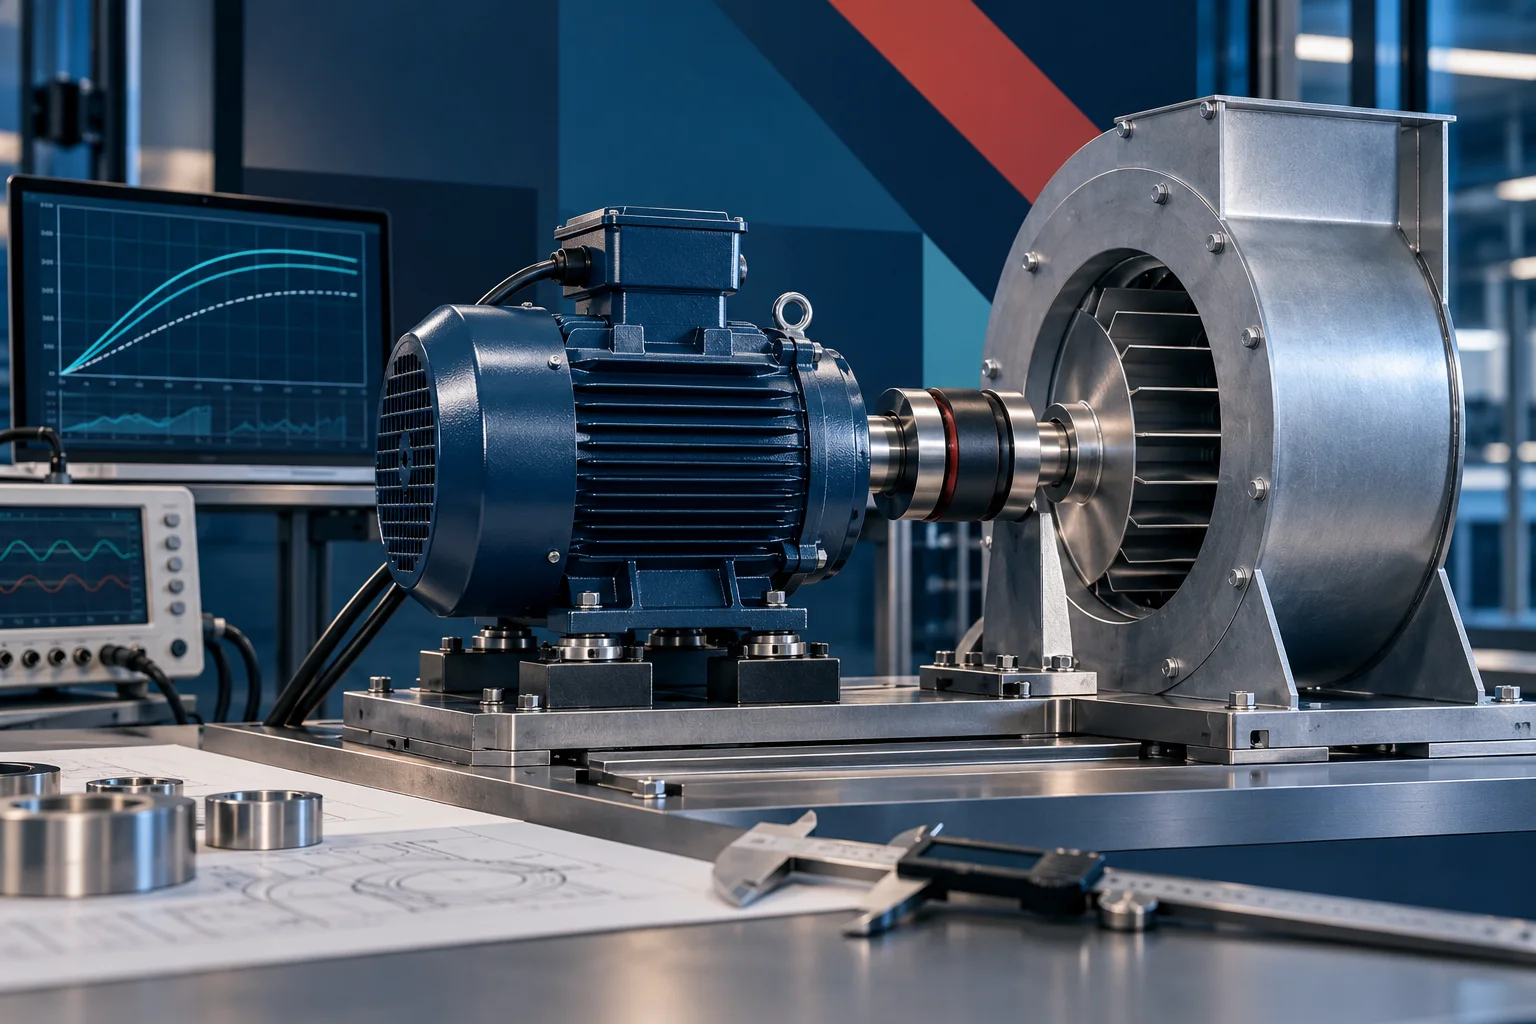
The image shows a fan mounted at an opening in a large enclosed apparatus with nearby controls. That is useful for discussing how a fan may be installed for a test and which connections and boundaries a report should describe. It cannot reveal the arrangement behind the enclosure, the calibration certificates, the measured points, or the status of any programme application.
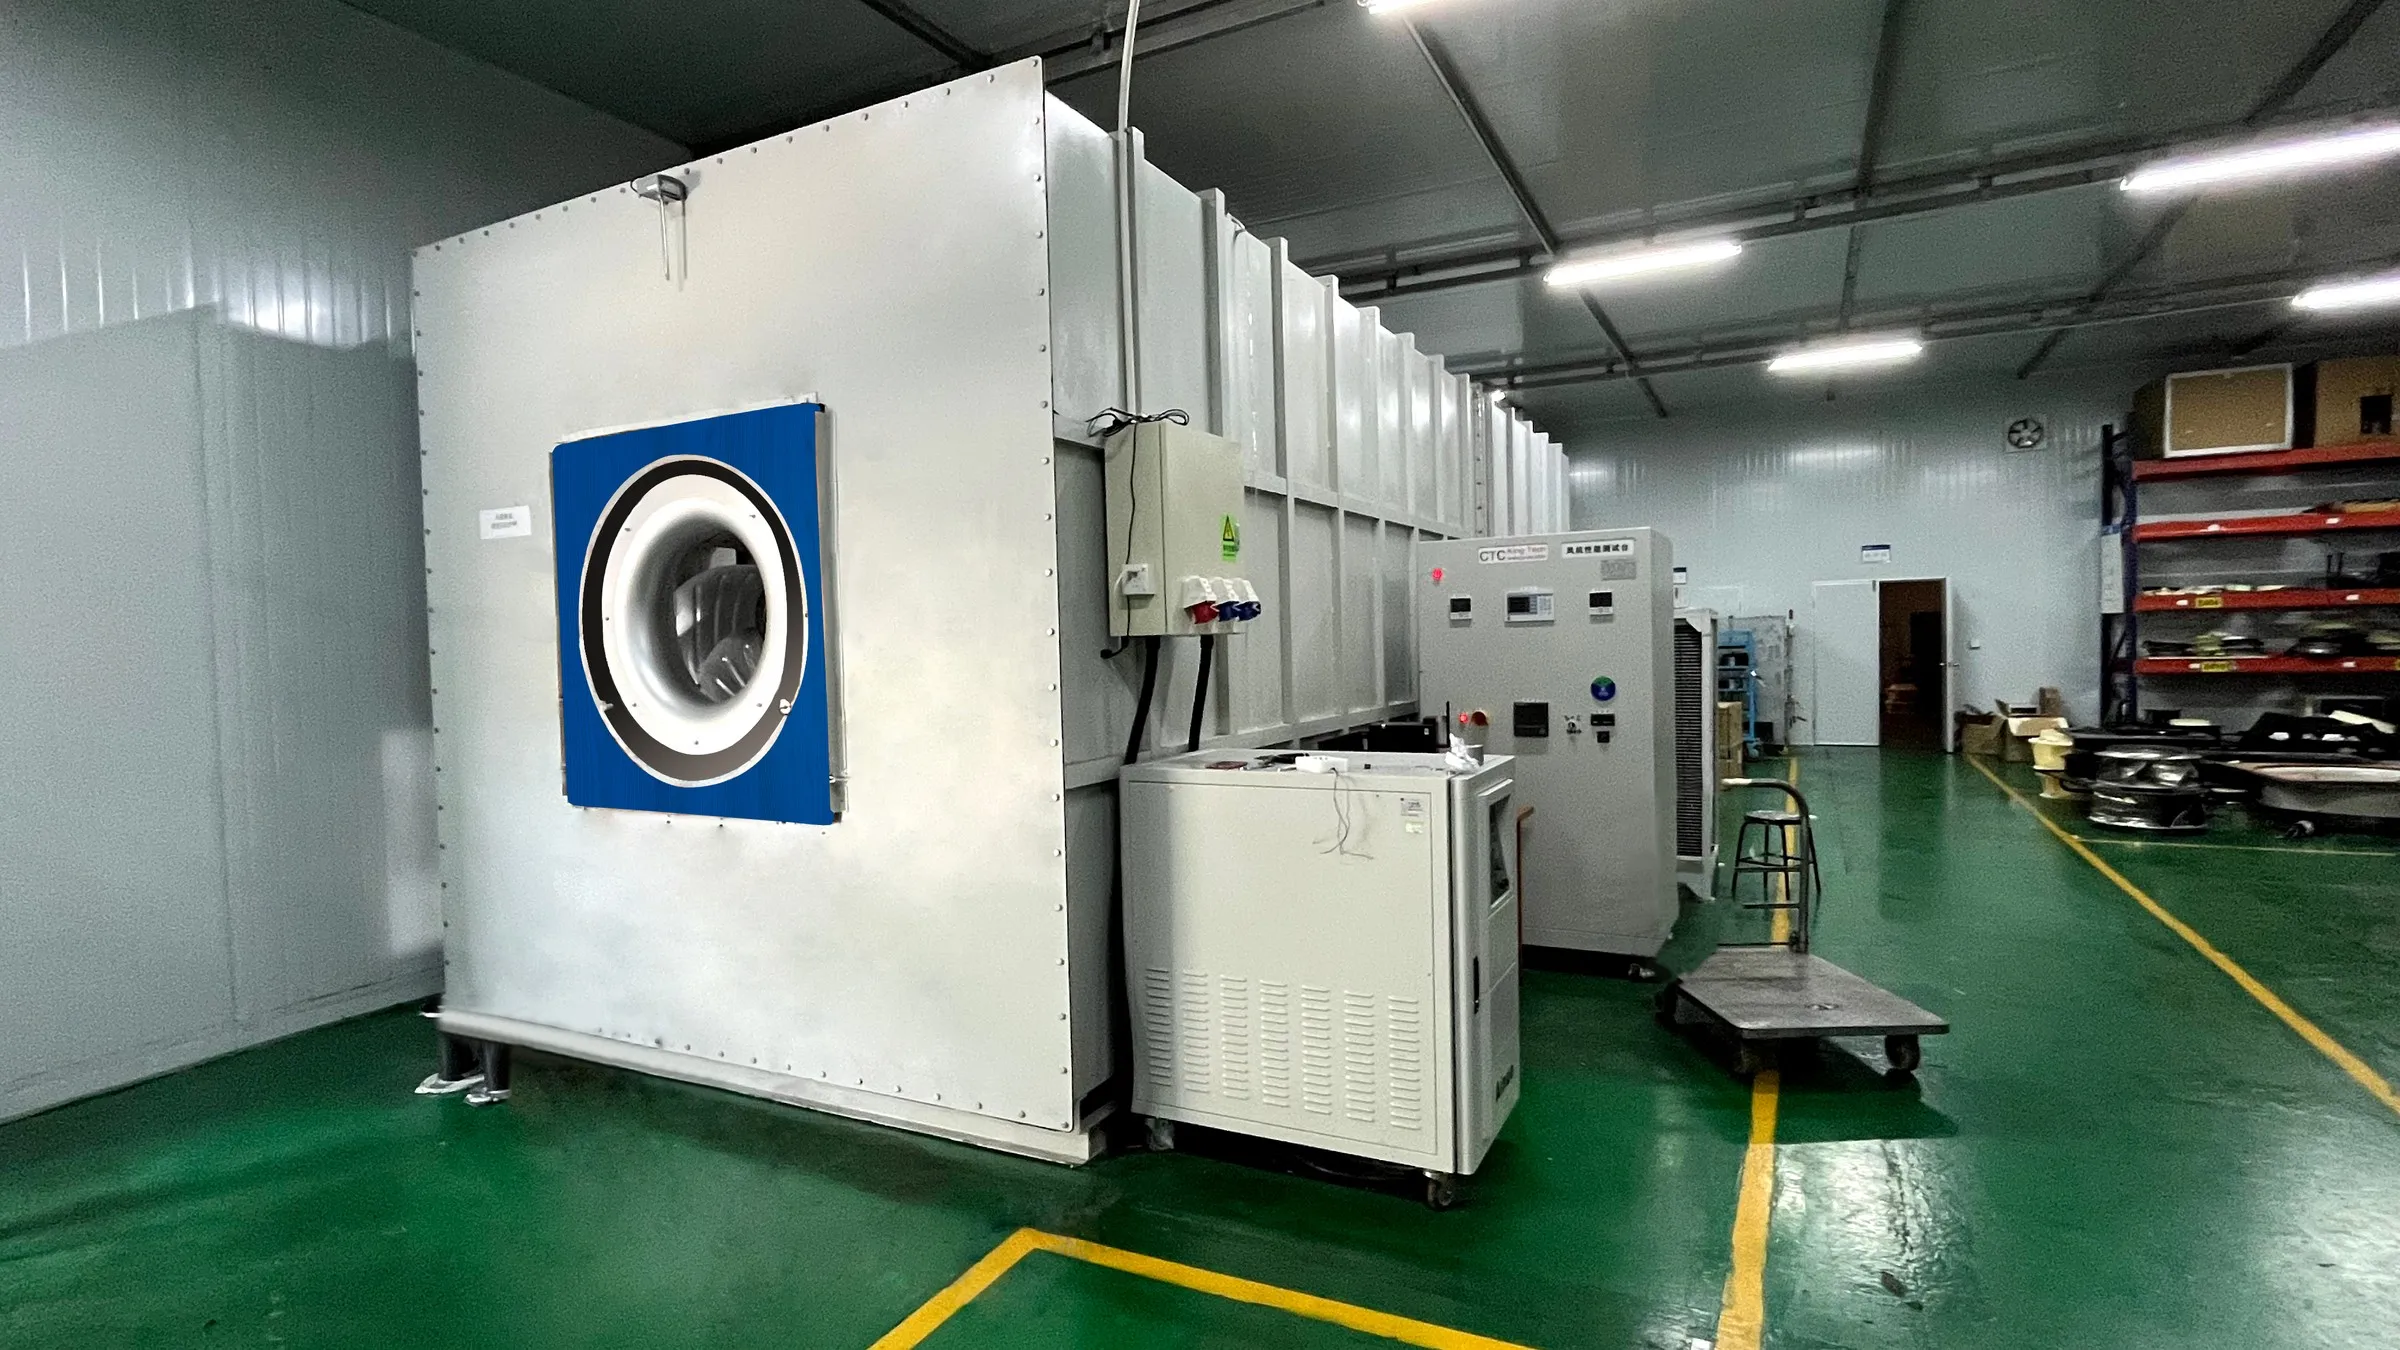
For a project review, identify the fan actually tested, its complete suffix, motor and controller, inlet and outlet accessories, rotational speed and mounting. A photograph of a facility, or a video of a different fan, cannot transfer results to your selected configuration. LONGWELL’s centrifugal-fan family helps identify candidate architectures; it is a family navigation path, not an exact duty-point or certification claim.
Which measurements become an air-performance curve
ANSI/AMCA Standard 210-25 / ASHRAE 51-25 establishes uniform laboratory methods for aerodynamic performance. The measured quantities include airflow rate, pressure developed, power consumption, air density and rotational speed. The specific apparatus and instrumentation must match the selected method and installation arrangement. Do not infer a nozzle, pressure tap or other hidden component from the facility photo alone.
At each steady operating point, a useful report should show the test configuration, airflow, pressure definition, speed, power boundary and relevant air conditions. Several measured points establish a curve; values drawn between points should be identified as interpolation, and values outside the measured range should not be presented as measured. A quoted maximum airflow and maximum pressure normally occur at different points, so they cannot be combined into one operating point.
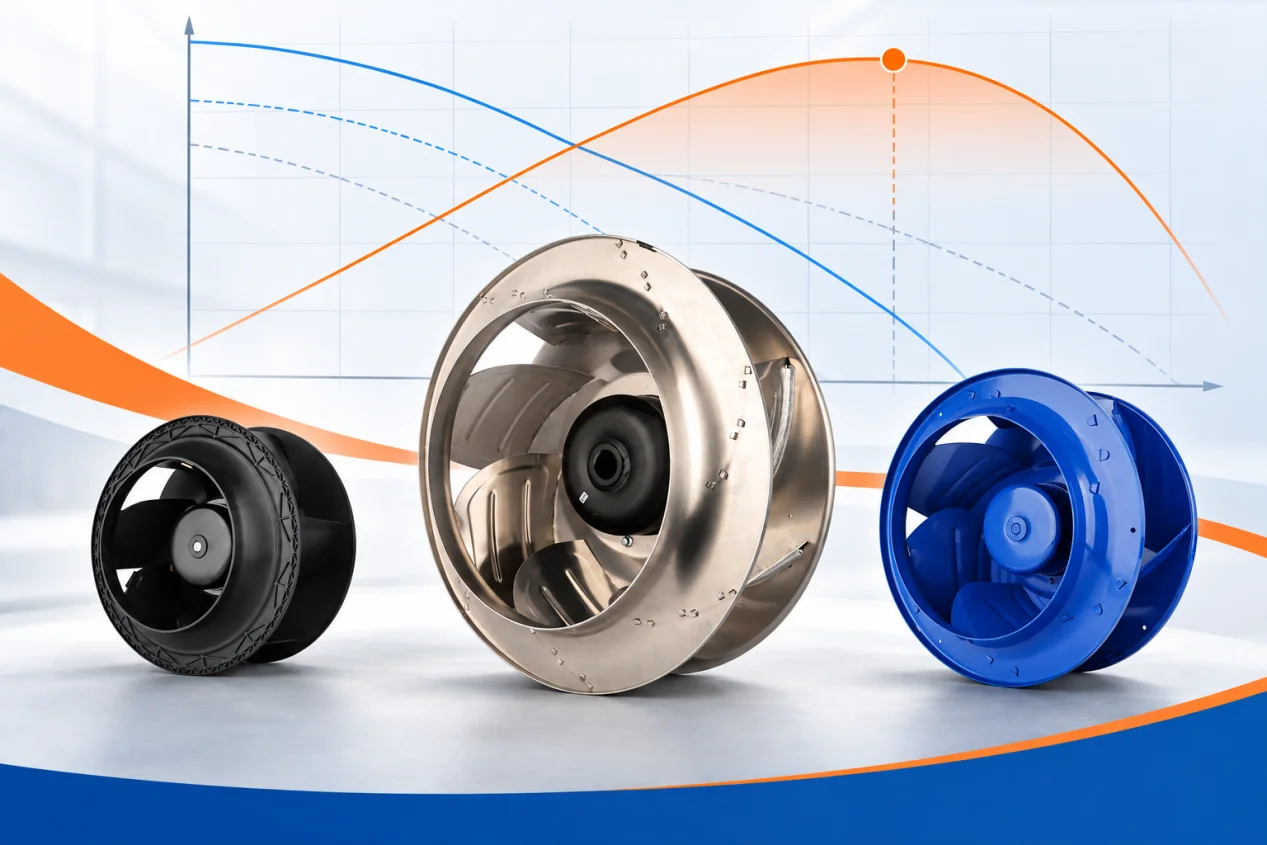
When reading a supplied curve, start with the required airflow and pressure of your system and check whether that point lies within the tested and published range. Our fan-curve guide explains how fan and system curves meet. Then request the underlying report for the exact offered model rather than borrowing a nearby model’s curve.
State the test arrangement and air-density basis
Open and ducted inlet or outlet arrangements can change the boundary seen by a fan. Ask the supplier to name the standard’s installation arrangement, any inlet cone, guard, duct or other accessory, and where pressure was measured. Compare two suppliers only after their pressure definitions and arrangements are aligned. An unlabelled curve cannot settle a disagreement about the installed machine.
Air density also belongs in the report. Temperature, pressure and other conditions affect the conversion between measured and stated values. Ask which values were measured, which were corrected to a stated reference basis, and what assumptions were applied. Do not assume that every curve uses the same reference density or that a warmer or high-altitude application will deliver the catalogue duty point without a new calculation.
Testing to a method is different from a certified rating
AMCA describes this distinction explicitly: a product tested in accordance with an AMCA standard is not necessarily an AMCA-certified product. Standard 210 concerns how aerodynamic performance is measured. AMCA Publication 211-26 gives technical procedures for aerodynamic ratings within the Certified Ratings Program, alongside the programme operating manual. A claimed certified rating needs the applicable programme scope, licensed product line and current directory status; a method statement or factory photograph is insufficient.
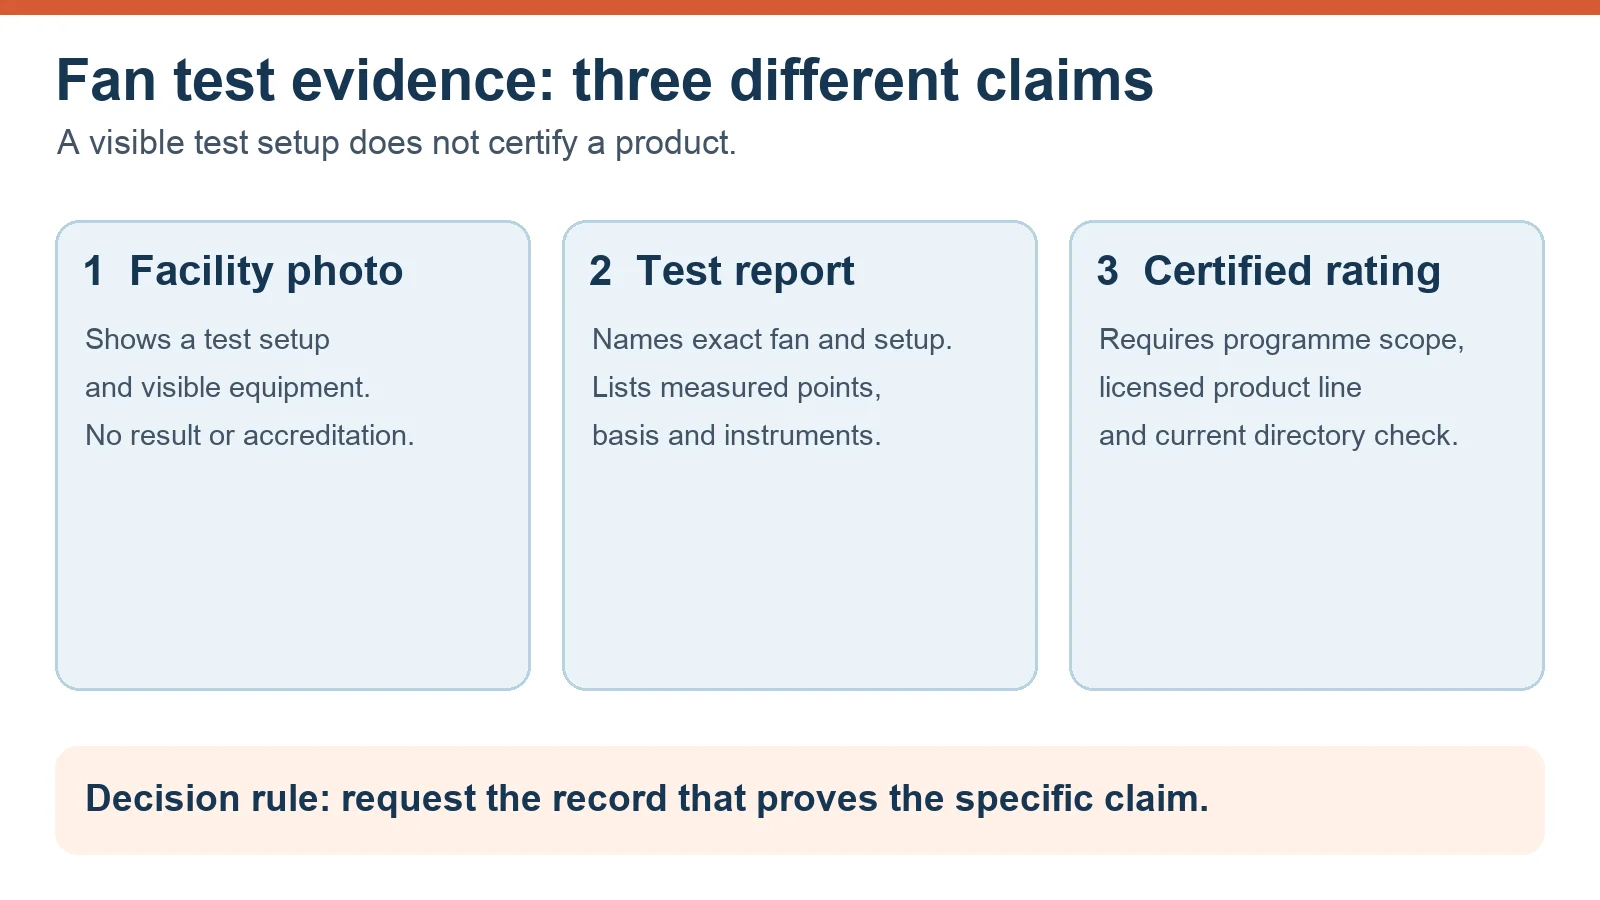
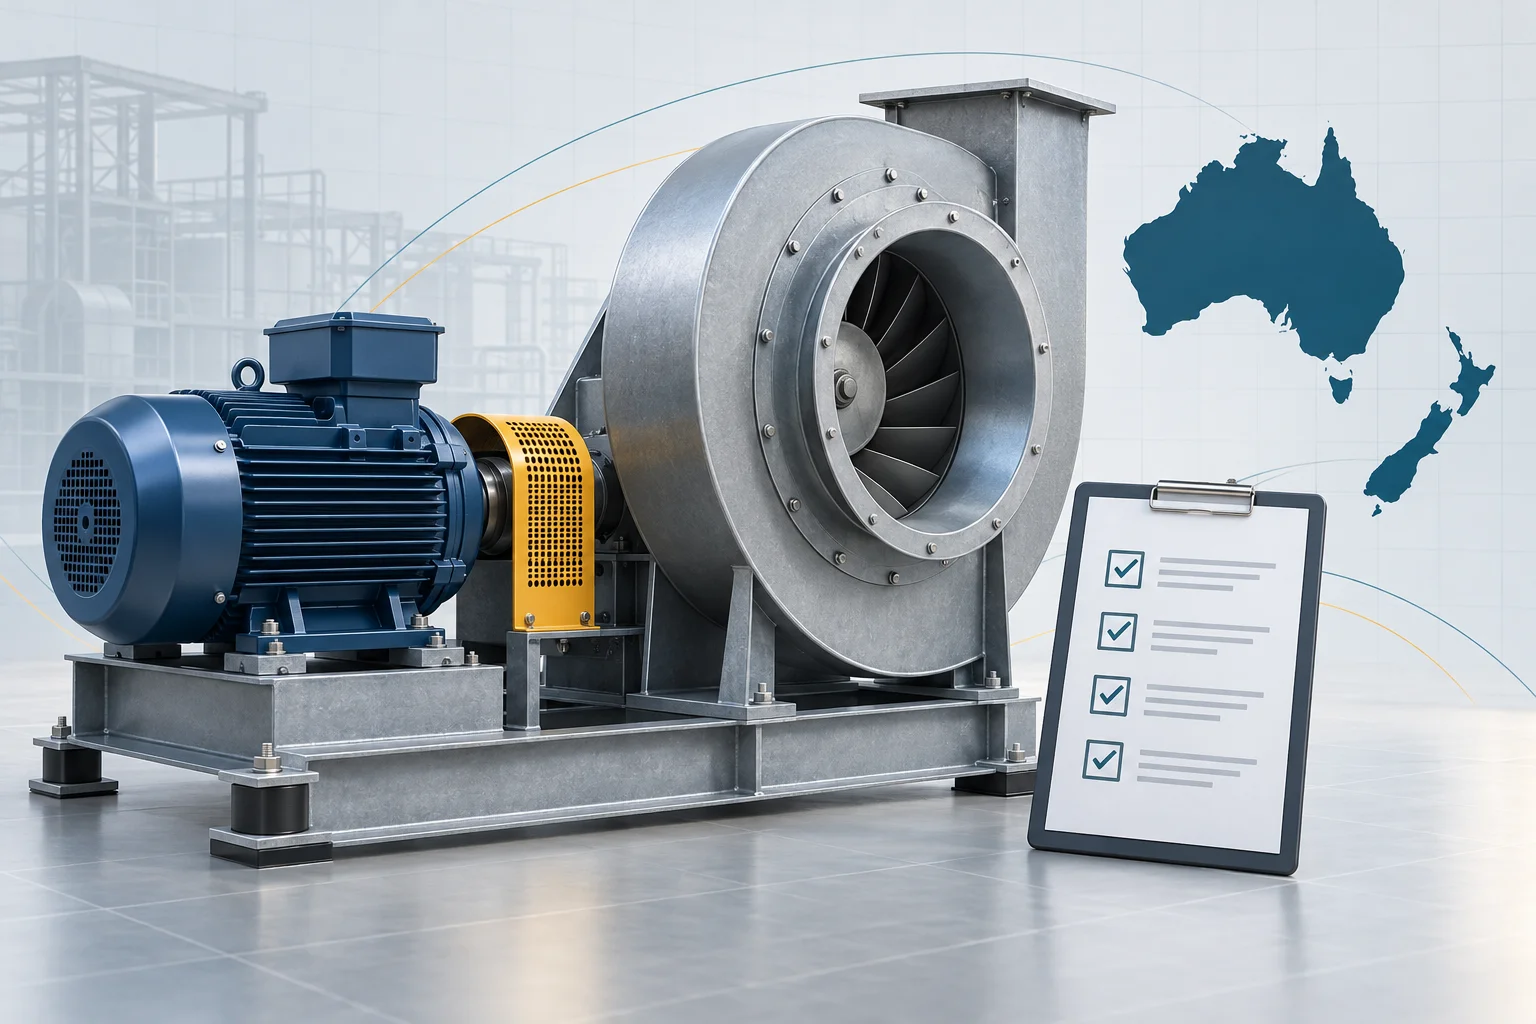
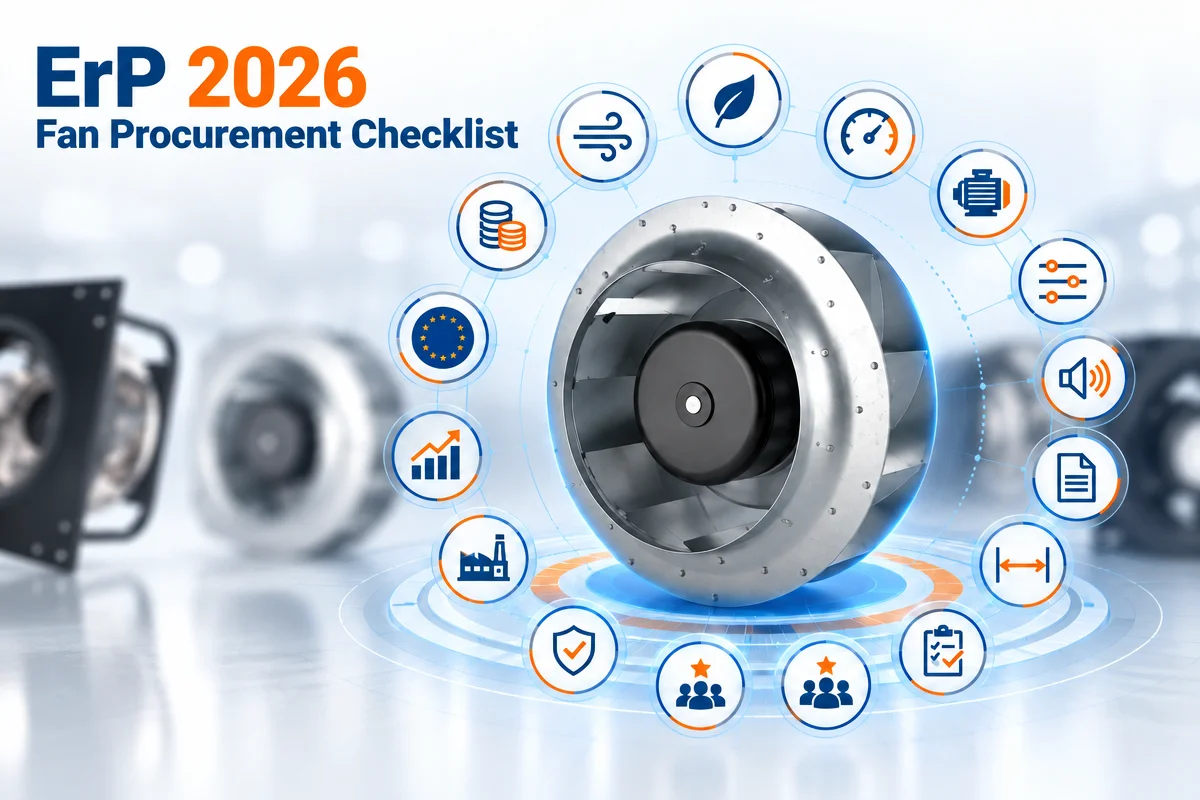
Use the diagram as a request list. Ask first what the photo proves, then which exact-model report supports the curve, and finally whether a certification claim can be independently checked. Keep acoustic ratings separate: AMCA identifies Standard 300 as a sound-testing method and Publication 311 as the sound-rating programme manual. An air-performance report alone does not establish a sound rating.
What to request for an exact-model review
- Complete model, suffix, motor and controller identification, drawing revision and accessories.
- Applicable test method, edition, installation arrangement and apparatus boundary.
- Measured operating points with airflow, pressure definition, speed, power and air conditions.
- Instrument identifiers, calibration status, test date and responsible laboratory or operator.
- How measured data became the published curve, including density basis and any interpolation.
- If certification is claimed, the programme, licensed line, rating scope and current directory entry.
A report for a related fan may be useful for preliminary family screening, but it is not the final evidence for a different suffix or controller. If a test record is missing, mark the performance or certification claim as pending. Do not convert a generic brochure, marketing white paper or facility image into a measured result.
Carry the laboratory boundary into the installation
A laboratory curve describes the stated test setup. A nearby inlet bend, outlet obstruction, loaded filter or different mounting can change the system resistance and the fan’s operating point. The size of that effect depends on the actual geometry and cannot be assigned a universal percentage from a photo. For commissioning, record the installed airflow, relevant pressure, speed and control setting at the agreed operating modes, then compare those conditions with the tested curve.
If the installed result differs, first reconcile the measurement boundary: instrument position, density basis, leakage, inlet and outlet configuration, and accessory state. This narrows the cause before anyone attributes the gap to the fan itself. A reliable purchase decision links the exact fan configuration, its test report and the system in which it will run.