
Fan selection goes wrong in the same place almost every time: the fan is chosen from the airflow figure on the nameplate, and the system resistance is guessed. The fan then delivers less air than expected, because the nameplate airflow is measured at zero static pressure and no real system runs at zero static pressure. This guide shows the method engineers use instead, the duty-point method, and walks through it on the LONGWELL Fan Selector, a free online tool that checks every model with a performance curve at your operating point. No login, no e-mail gate, nothing to install.
What a duty point is, and why the nameplate is not enough
A duty point is the pair of numbers your system needs at the design condition: an airflow (m³/h, CFM, l/s) and the static pressure the fan must overcome to move that airflow through the ductwork, coils, filters and grilles (Pa, in. wg, mmH₂O). A fan can run at any point along its performance curve, but only on the curve. Ask it for more pressure and it gives up airflow; that is the trade every fan makes.
The two figures on a catalogue nameplate are the two ends of that curve: maximum airflow at zero pressure, and maximum static pressure at zero airflow. They never occur together. A fan rated at 11,000 m³/h and 910 Pa does not deliver 11,000 m³/h against 910 Pa; at 8,000 m³/h it may have about 680 Pa available, and that is the number that matters.
Step 1: define the duty point
- Airflow comes from the job: a heat load to remove, an air-change rate for a room, or the flow a coil or filter is designed for. If you are starting from a room or a heat load, the air-changes-per-hour calculator and the enclosure cooling airflow calculator give the figure in minutes.
- Static pressure is the sum of every loss between the inlet and the most remote outlet: straight duct, bends, transitions, coils, filters and grilles. Size it for the dirty-filter condition, not the clean one. The duct size and static pressure calculator adds these up from the duct layout.
- Air density changes the pressure a fan produces. Curves are published at standard air (20 °C, 101.3 kPa, 1.2 kg/m³); at altitude or in hot exhaust, correct the required pressure first with the air density and altitude calculator.
The worked example in this article is a CRAH fan wall in a data hall: 8,000 m³/h at 600 Pa. The same steps apply to a compact AHU at 3,000 m³/h and 250 Pa or a cabinet cooler at 300 m³/h and 100 Pa.
Step 2: run the selector
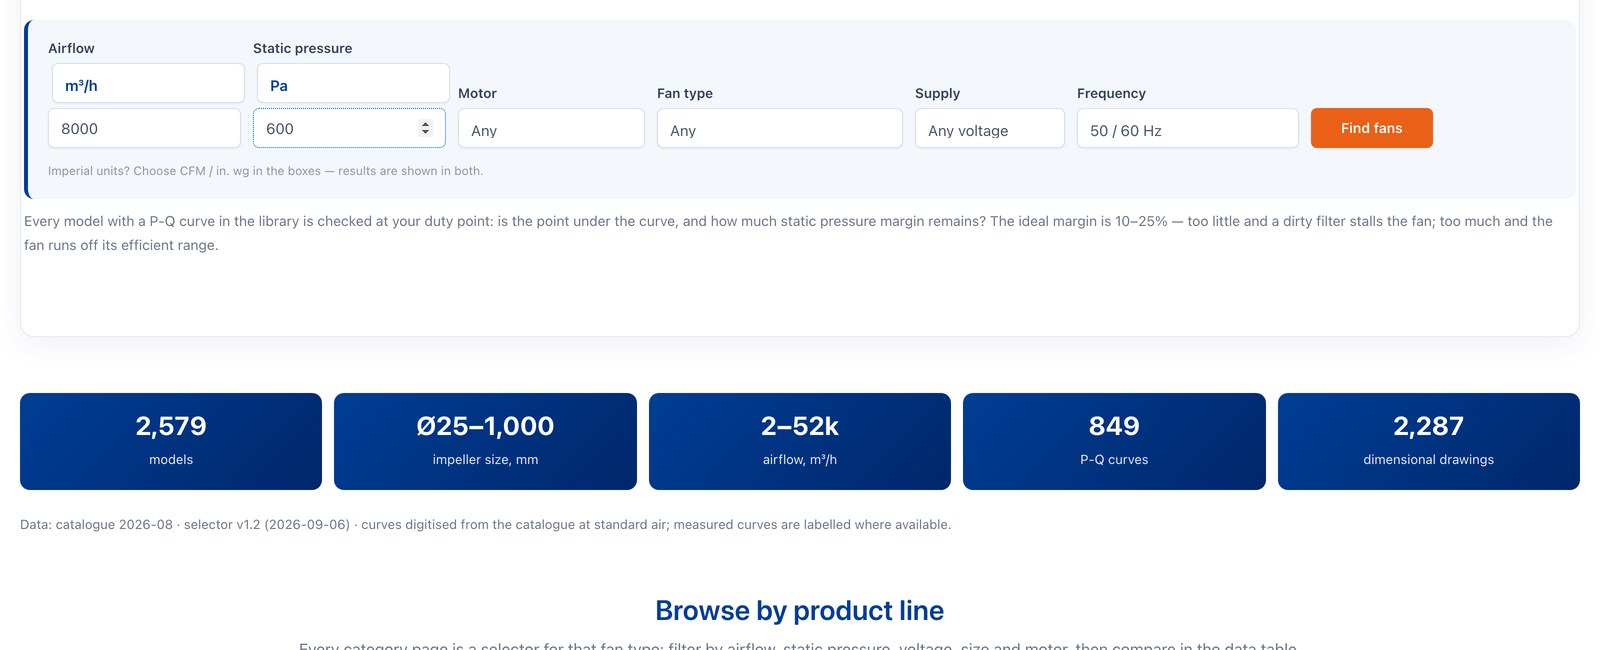
Open the Fan Selector, type the airflow and the static pressure in whatever units you have, and press Find fans. Four optional filters narrow the field before you look at curves: motor type (EC, AC or DC), fan type (centrifugal, axial, cross flow, duct, cooling and so on), supply voltage and mains frequency. If the application already fixes one of them, set it now; every candidate that survives is a real option.
Step 3: read the shortlist
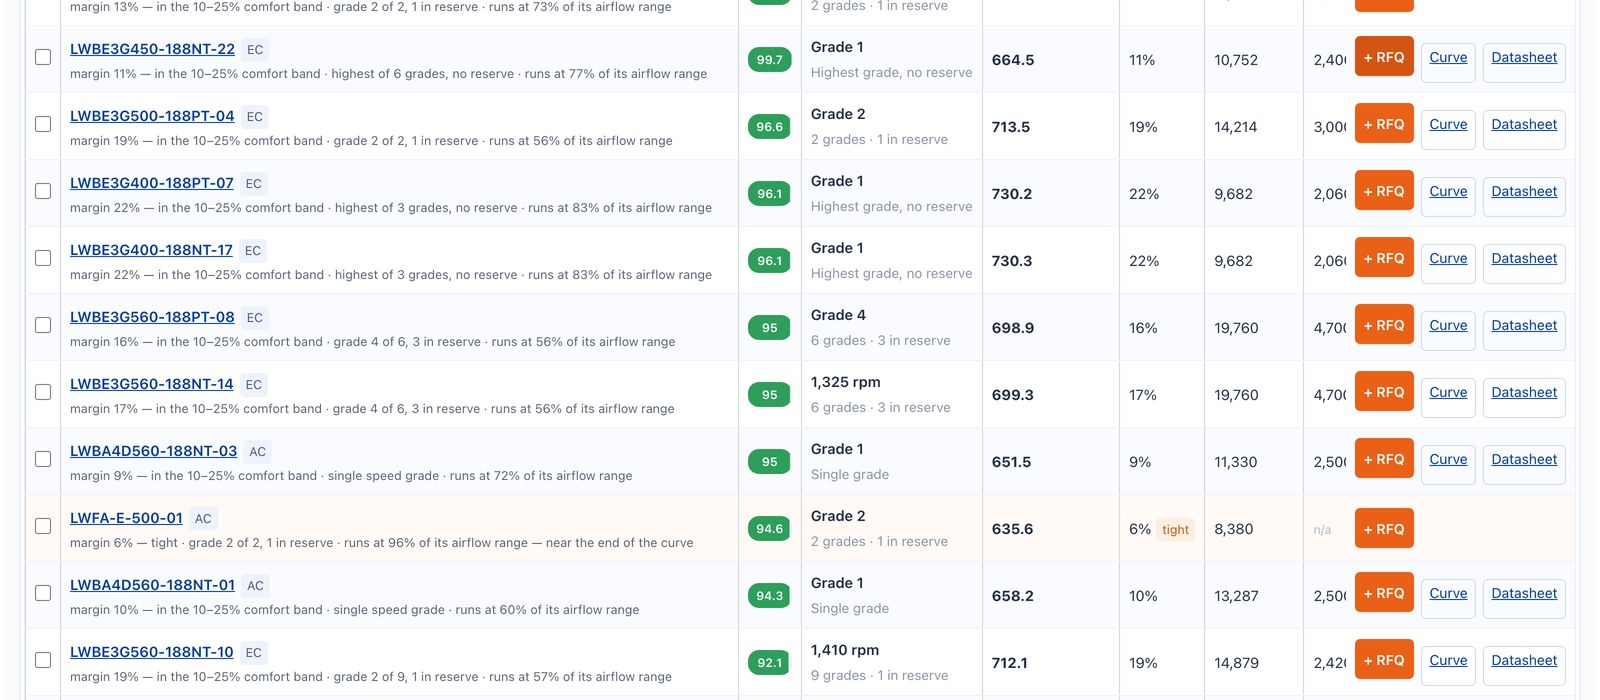
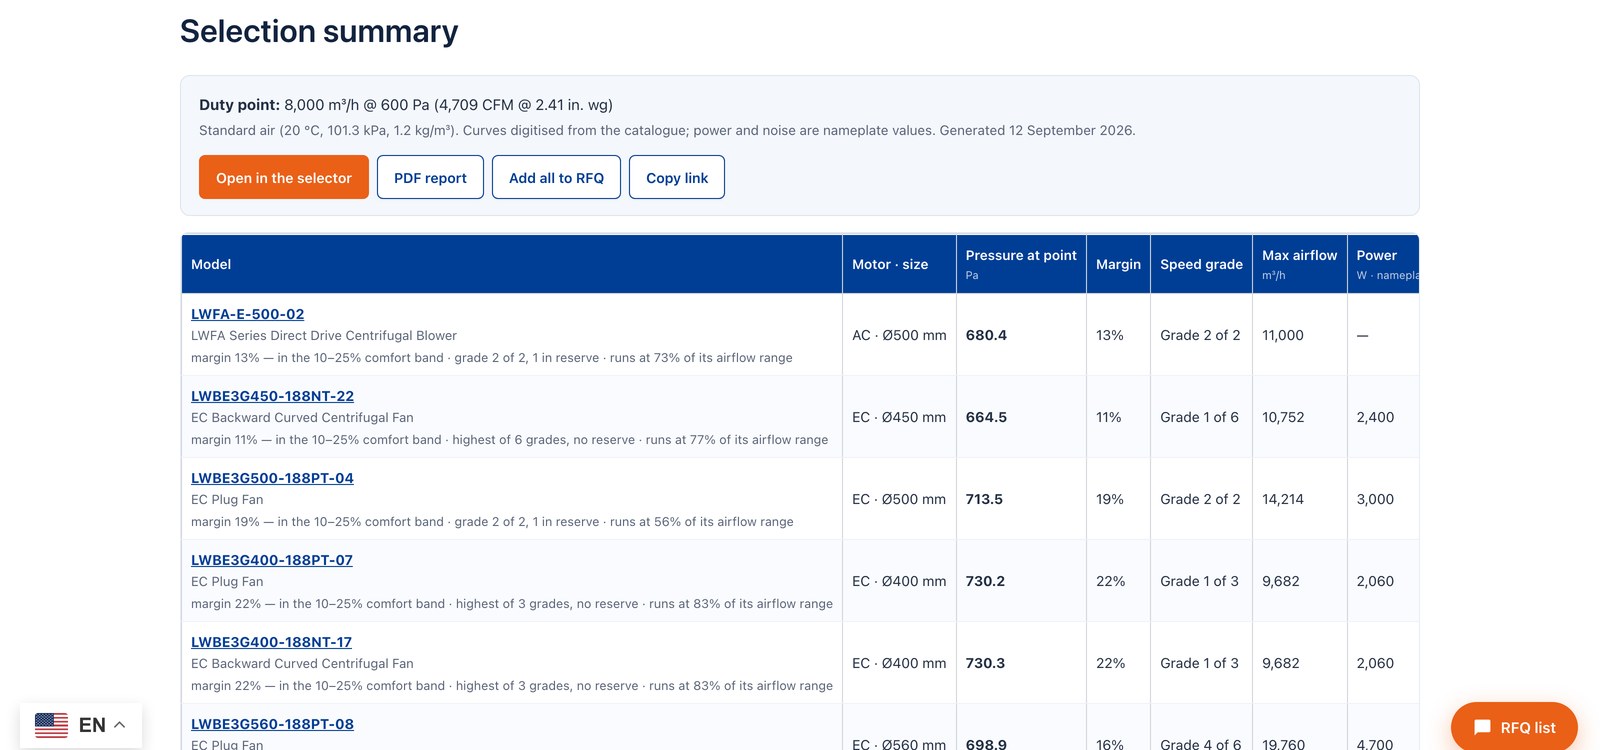
For 8,000 m³/h at 600 Pa the selector returns 33 models. Each row answers four questions:
- Pressure at point. The static pressure this model has available at your airflow, read off its curve. The first row shows 680 Pa against the required 600 Pa.
- Margin. The reserve above your requirement, as a percentage. The comfort band is 10–25 %: enough to keep the airflow when filters load up, not so much that the fan runs far below its efficient range. Below about 8 % the row is flagged tight.
- Speed grade and reserve. EC and multi-speed models have several curves. The selector picks the lowest grade that still clears your point and tells you how many higher grades remain in reserve. Reserve means you can raise the speed later without changing the fan.
- Match score. One number that combines margin, reserve grades and a penalty for fans running at a small fraction of their airflow range, so the list is sorted by fit rather than by size.
Two more things the table tells you before you open a single datasheet. Models with a curve in the library come first; where a model only has nameplate maxima, its pressure is estimated with a straight-line curve and clearly marked as an estimate to be verified. And the Data column says whether the curve was digitised from the catalogue or measured in the wind tunnel.
Step 4: verify on the curve
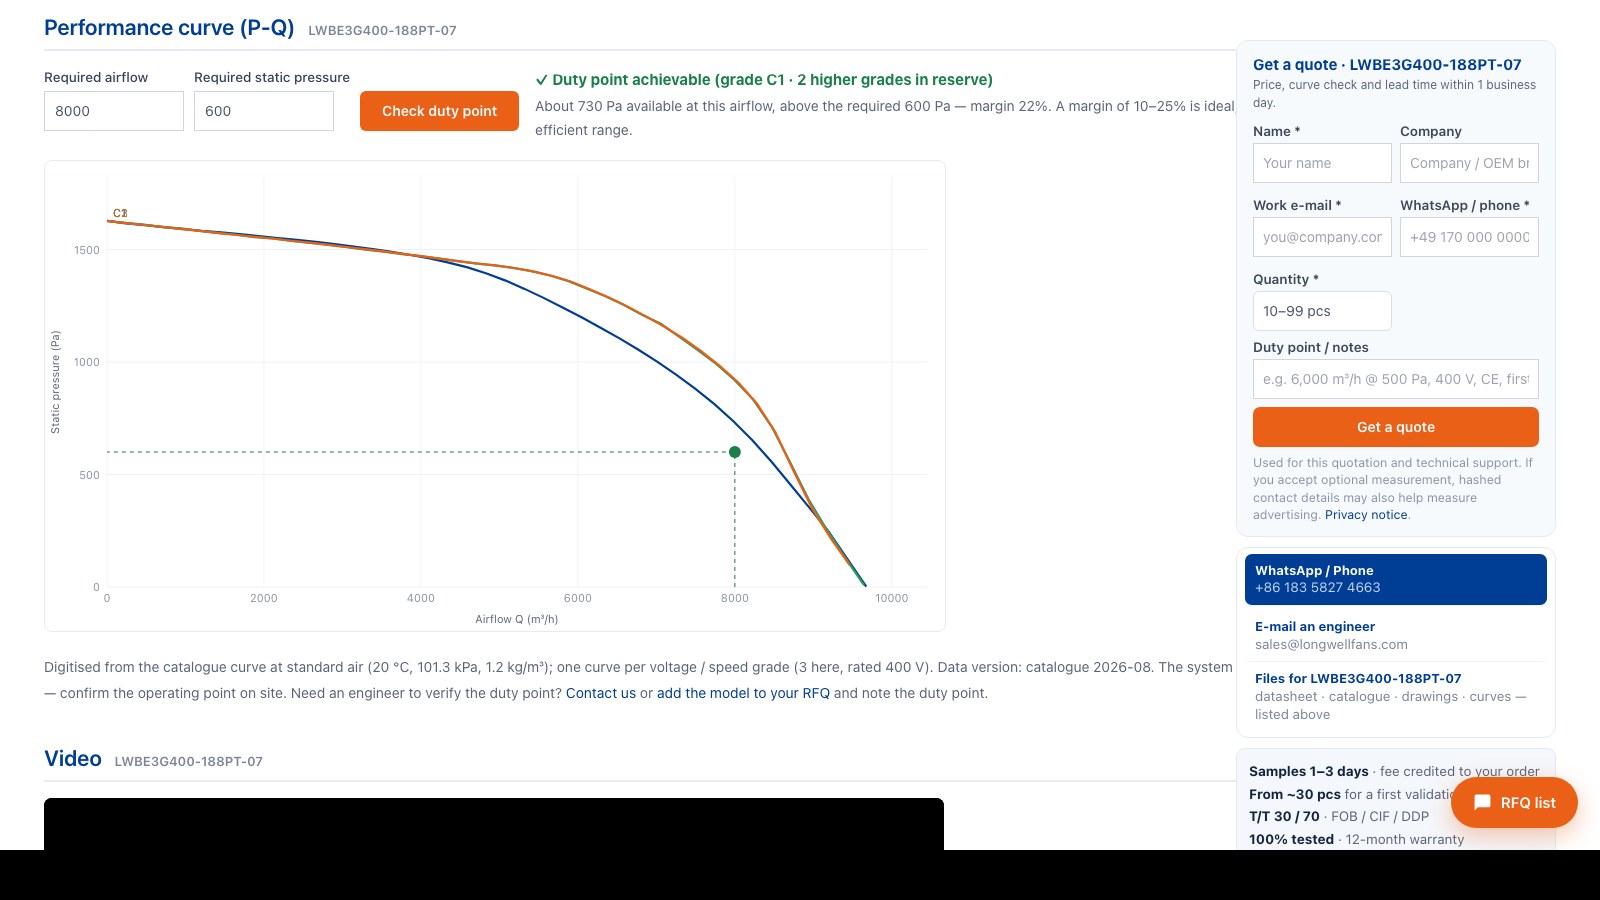
Open a model and the curve is on the page, together with a duty-point check. The point is drawn on the P-Q curve and the result is spelled out: achievable or not, which speed grade, and the margin. For LWBE3G400-188PT-07 the check reads: grade C1, about 730 Pa available, margin 22 %, two higher grades in reserve. That is the row you saw in the shortlist, now with the curve behind it.
The model page has no tabs. The curve, the dimensional drawing, the technical description and the alternatives follow each other on one page, with a jump bar at the top; you scroll once.
Step 5: pull the drawing package
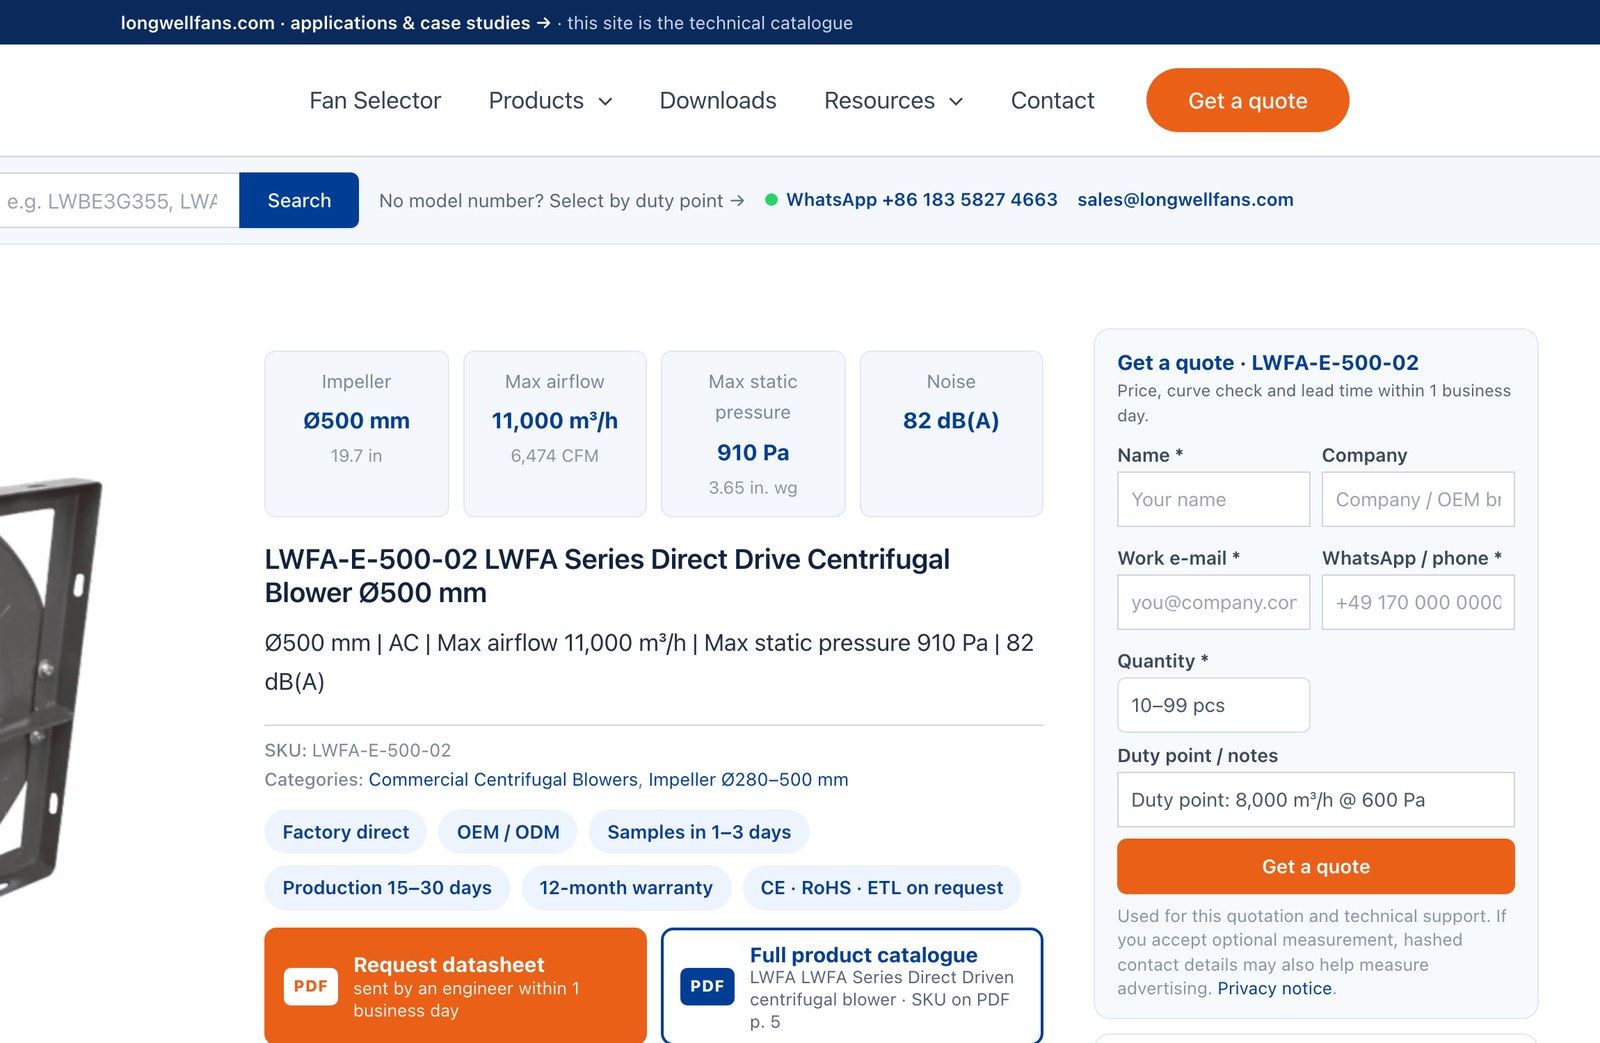
Every file for the model is listed on the page itself: the datasheet, the full product catalogue opened at the page where the model appears, the dimensional drawing in PDF and as an image, and the wiring diagram where one exists. STEP and SolidWorks models are listed where they exist and released on request after a short project check, because they contain the blade geometry.
Step 6: check the alternatives and send one RFQ
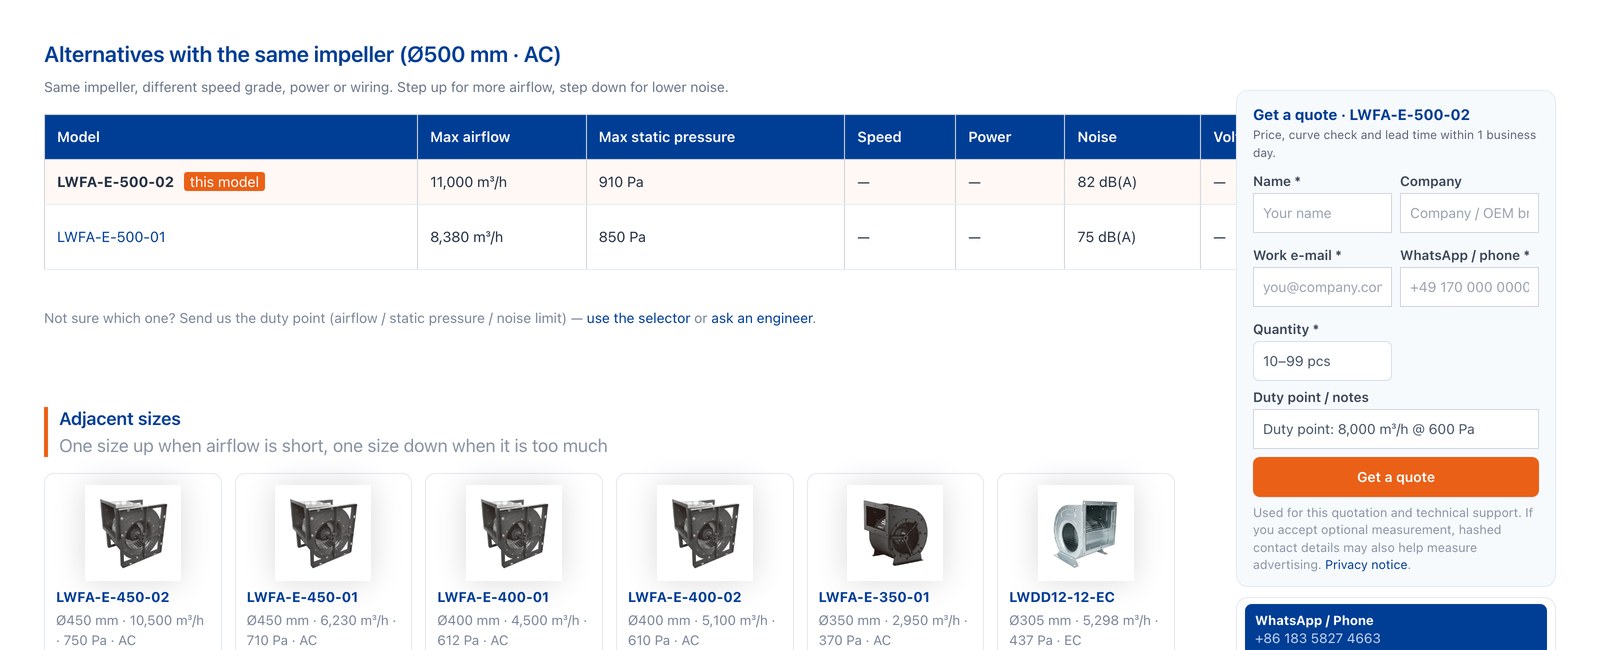
Below the description the page lists the same impeller in its other speed grades, one size up and one size down, and fans at a similar duty on a different motor platform. If the first candidate is tight, the next size is one click away.
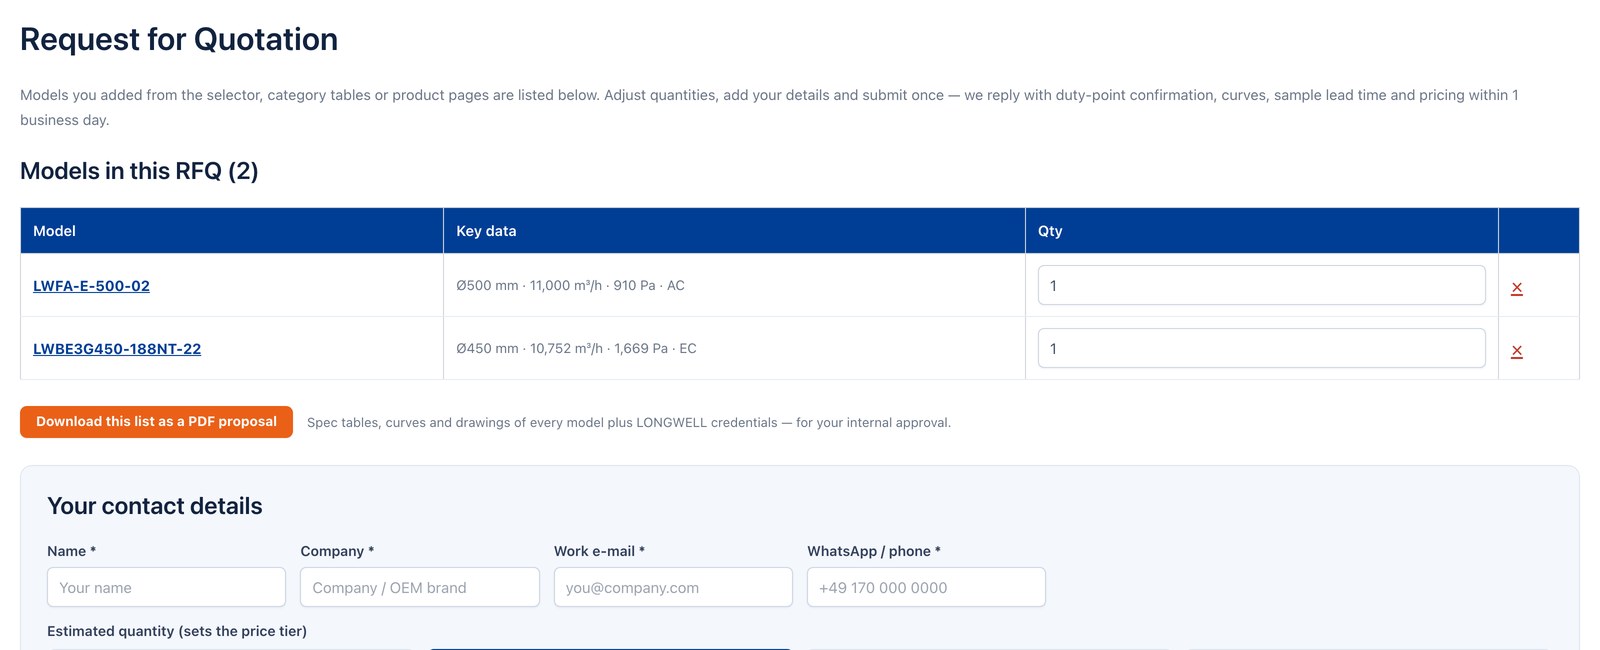
Add the candidates to the RFQ list from the shortlist or from the model page, set quantities, and submit once. An engineer replies within one business day with the duty-point check, performance curves, price and sample lead time. Stock models ship as samples in one to three days; series production is 15–30 days.
Two more outputs help when the decision involves colleagues: the PDF selection report bundles the shortlist with the specification table, curve and drawing of each model, and the summary page is a plain link that opens the same shortlist on any device, without a form.
A short checklist
- Select on the duty point, never on nameplate airflow.
- Size the static pressure for the dirty-filter condition and correct for air density.
- Aim for a 10–25 % pressure margin; treat under 8 % as tight and over 25 % as oversized.
- Prefer a model with speed grades in reserve when the load is uncertain.
- Verify the point on the curve, then download the drawing before sending the RFQ.
Frequently asked questions
Is the LONGWELL Fan Selector free?
Yes. It runs in the browser, requires no account and no e-mail address, and every datasheet, catalogue and drawing is a direct download.
How many fans does it cover?
2,579 LONGWELL models with catalogue ratings, impellers from Ø25 mm to Ø1,000 mm, and 849 models with a P-Q curve in the library. Models without a curve are still listed, with an estimate that is marked as such.
Where do the curves come from?
Most are digitised from the published catalogue curves at standard air; wind-tunnel measured curves are labelled measured where they exist. Final selection is confirmed by a LONGWELL engineer on the measured curve before an order.
Can I select by CFM and inches of water?
Yes. Airflow accepts m³/h, CFM, l/s and m³/min; static pressure accepts Pa, in. wg, mmH₂O and kPa. Results are shown in both metric and imperial units.
What if no model covers my duty point?
Use the adjacent sizes on the closest model, or send the duty point with the RFQ form; an engineer proposes a fan or a custom variant.
Try it with your own numbers: select.longwellfans.com, or read how it fits into the rest of the site on the Fan Selector page.