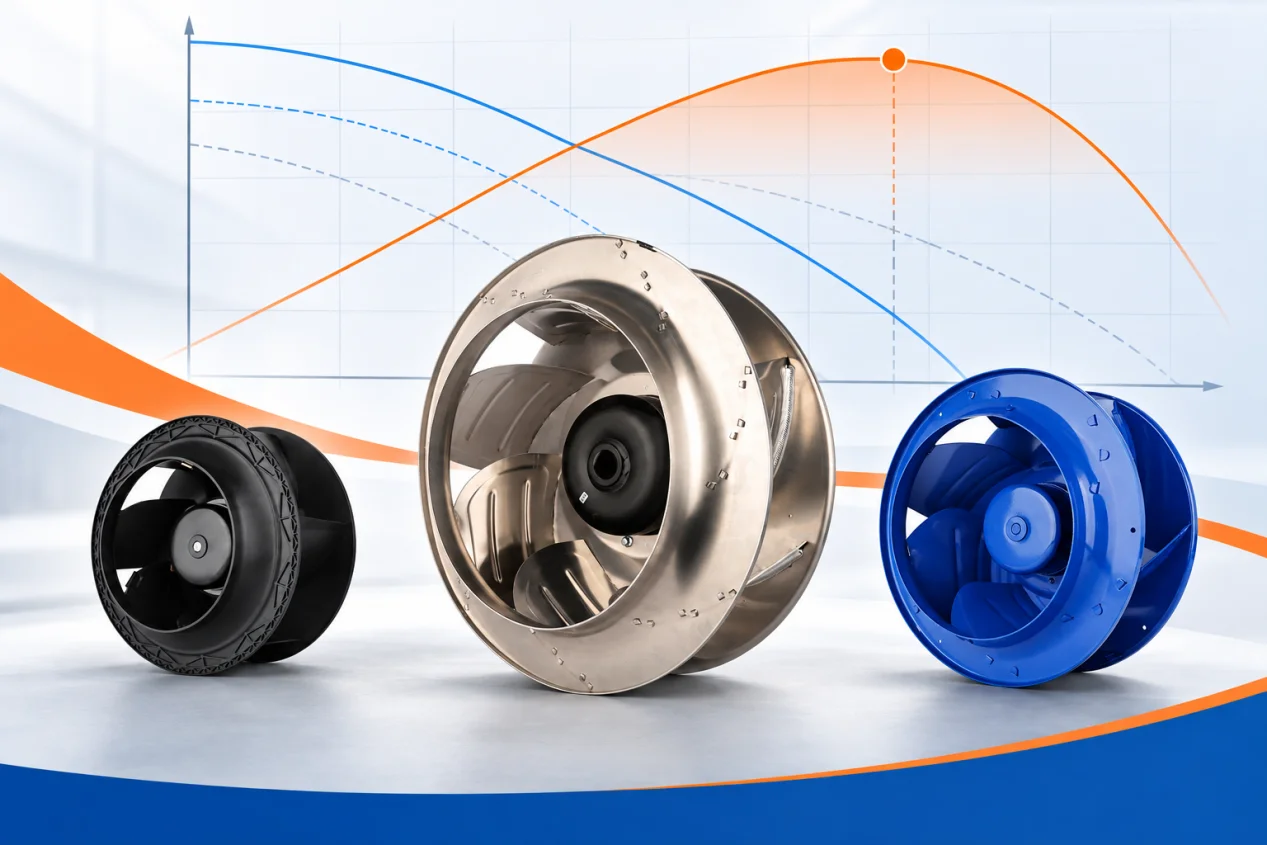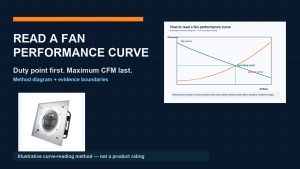
A centrifugal fan curve is a map of measured operating points, not a promise that every value on the sheet occurs at once. Maximum airflow usually sits near the low-pressure end; maximum pressure sits near the low-flow end. A real duct, filter, coil, cabinet, or process system chooses one operating point between them.
For a defensible shortlist, start with required airflow and pressure, find the fan-curve and system-curve intersection, then read power, efficiency, sound, and operating limits at that same airflow. Keep the pressure definition, speed, air density, test arrangement, and electrical boundary attached to every value.
Read the axes and test boundary before the numbers
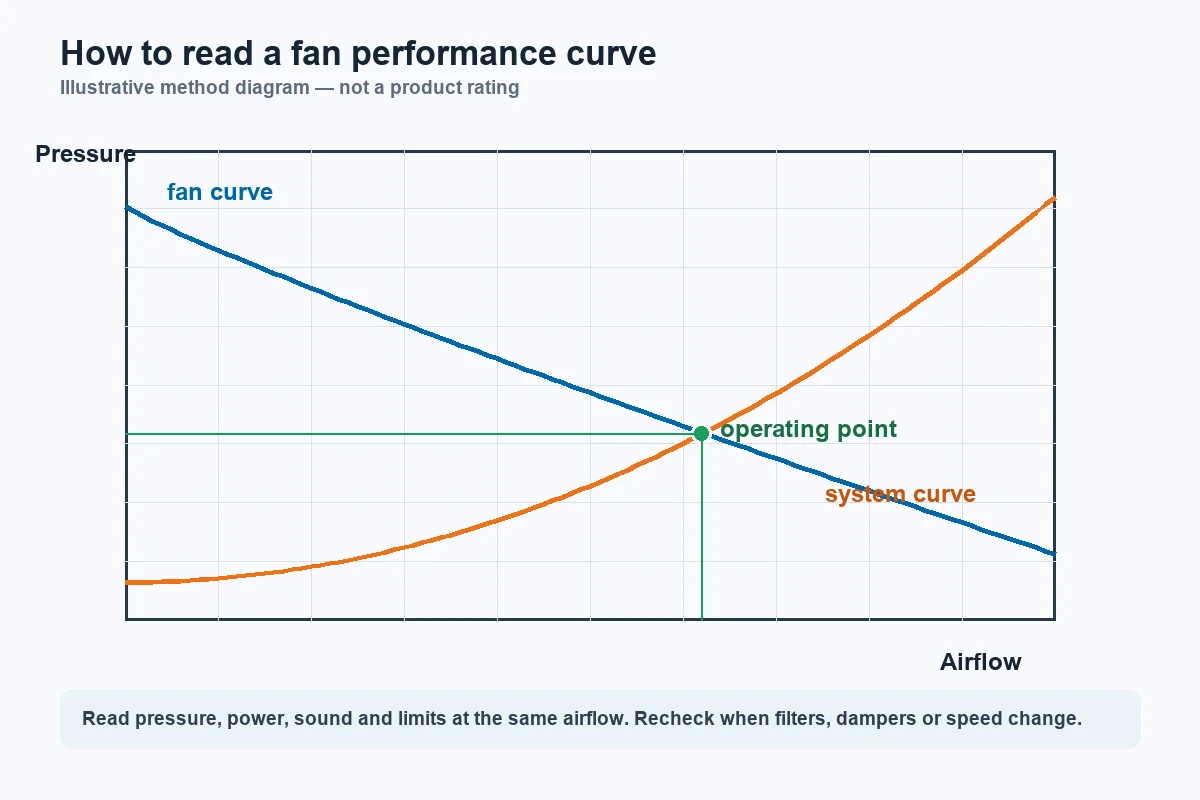
Airflow normally appears on the horizontal axis. Fan static pressure or fan total pressure appears on the vertical axis. Static and total pressure are not interchangeable, so use the definition required by the equipment specification. Check the units as well; CFM and cubic metres per hour, or pascals and inches of water gauge, must not be mixed during comparison.
Next, confirm rotational speed, air density, inlet and outlet arrangement, and the exact fan configuration. Determine whether the power curve reports shaft power, motor input, or complete electrical input. Two charts with similar shapes can still describe different boundaries.
Suppose a teaching duty is 5,000 m³/h at 600 Pa. Those two values form one point. Any adjacent power or efficiency value is read vertically at that airflow; it is not a universal Longwell rating and should not be transferred to another model or speed.
Find the fan-and-system intersection
The descending fan curve shows the pressure the fan develops as airflow changes. The rising system curve represents the resistance of ducts, fittings, filters, coils, grilles, and process components. Their intersection is the expected operating point.
That point moves when the system changes. A loaded filter or closing damper raises resistance and generally shifts operation toward lower airflow. A more open path moves the intersection in the opposite direction. The fan does not remain at the original design dot simply because that dot appears in an RFQ.
Define clean, normal, loaded, minimum-command, and maximum-command conditions where they matter. Each credible system curve should intersect an available fan or speed curve inside the exact manufacturer’s permitted region. Do not invent one universal “safe percentage” around the pressure peak.
Read every performance layer at one airflow
At each operating airflow, first confirm pressure. Then read absorbed power so the motor, controller, and electrical supply have appropriate margin across the full system range. Maximum input elsewhere on the curve is not the duty-point input, and a single watt figure cannot replace the complete power curve.
Check efficiency and sound at the same speed and duty, using the stated measurement quantity and test boundary. Then confirm current, temperature, maximum permitted speed, control range, and any model-specific operating limits. If a candidate crosses the duty only near an unstable or prohibited region, ask for another selection rather than hiding the concern with throttling.
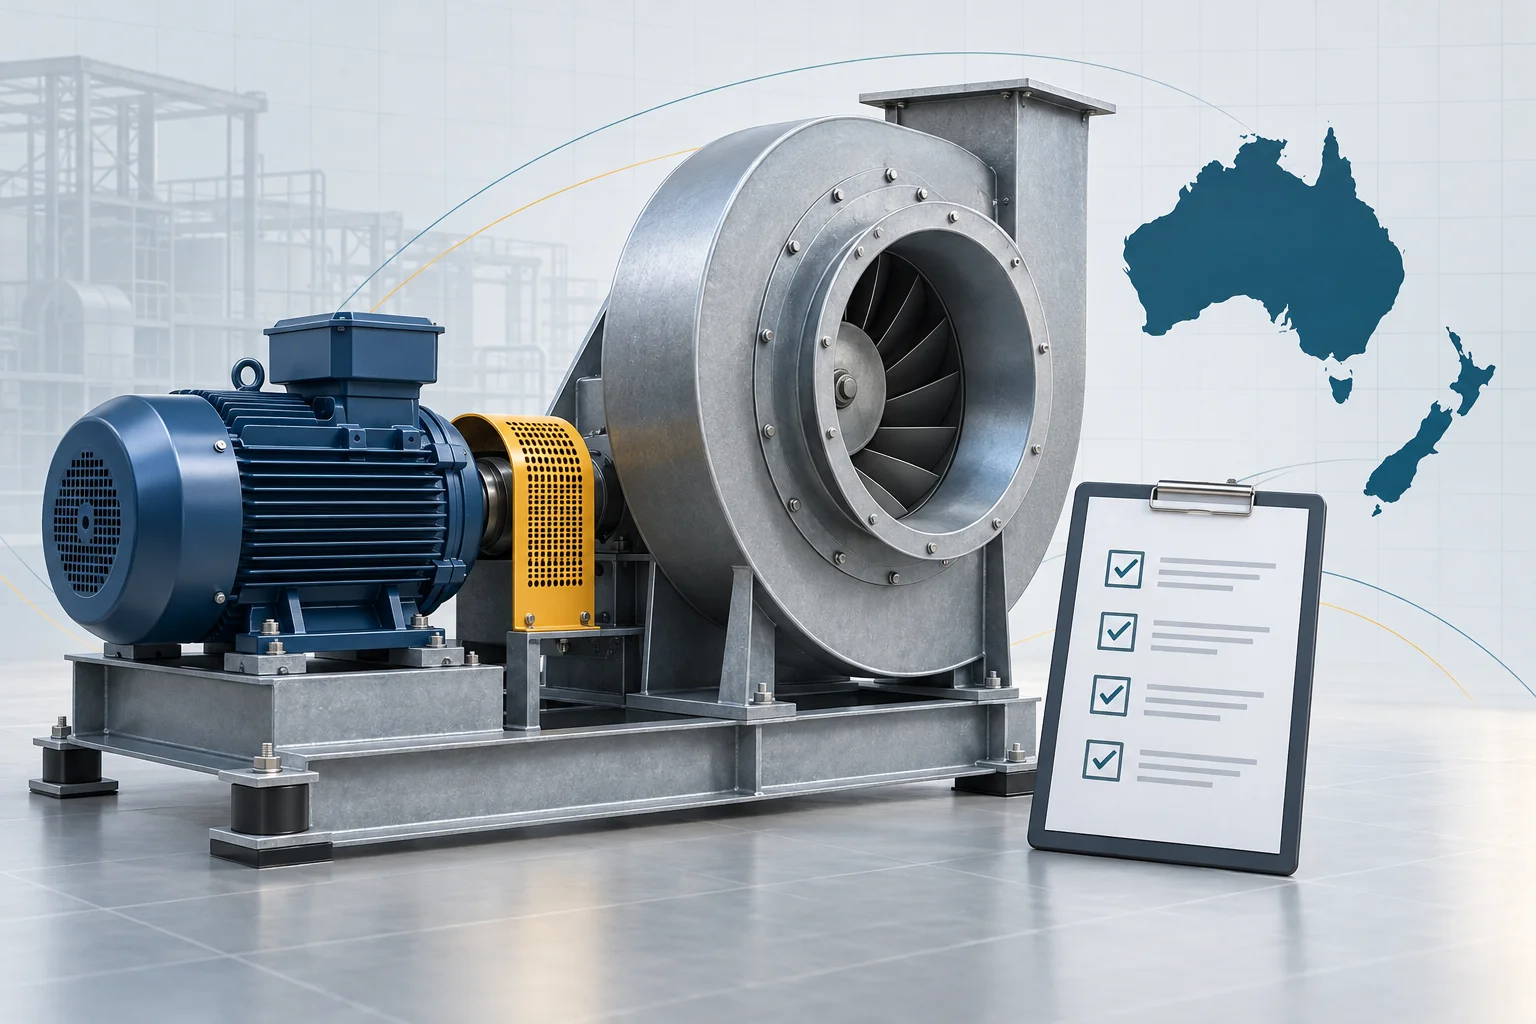
If you are still organizing the selection inputs, the EC fan selection checklist provides a practical sequence. It is a preparation aid, not approval of a particular model suffix.
Use speed curves and fan laws as screening tools
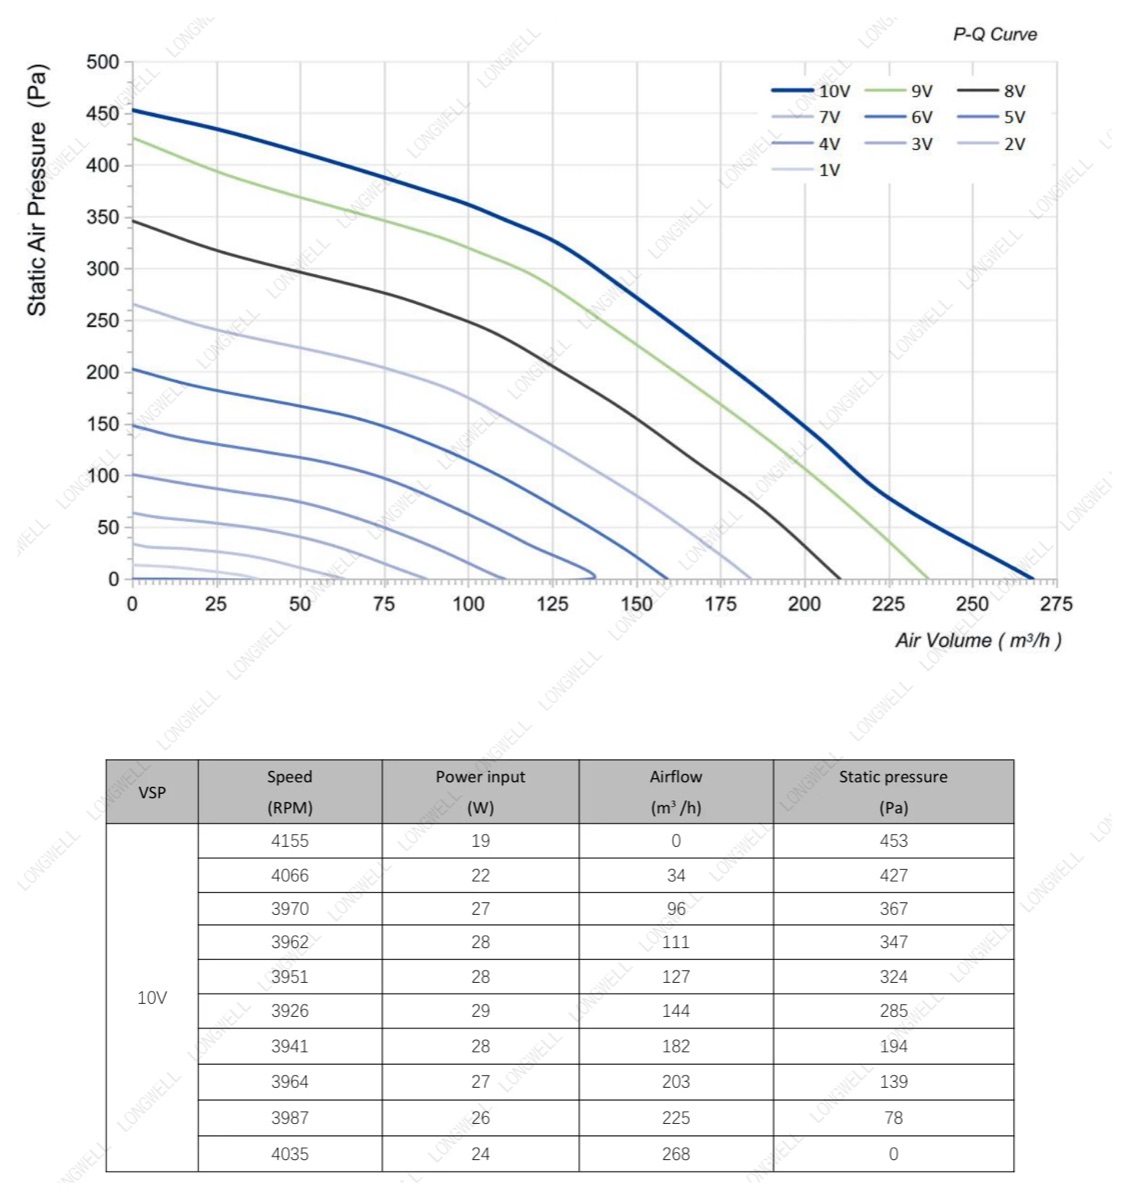
Variable speed produces a family of curves. For the same fan under appropriate similarity conditions, airflow changes approximately with speed, pressure with speed squared, and power with speed cubed. These relationships are useful for preliminary screening, but the intersection still must be recalculated at each important speed.
Fan laws do not override motor heating, controller current, maximum speed, air-density changes, or the real system curve. Confirm minimum command, stable operation, power, and sound throughout the intended control range. If a supplier scales one curve to a new speed, ask which similarity assumptions and limits were applied.
Account for installation, evidence, and commissioning
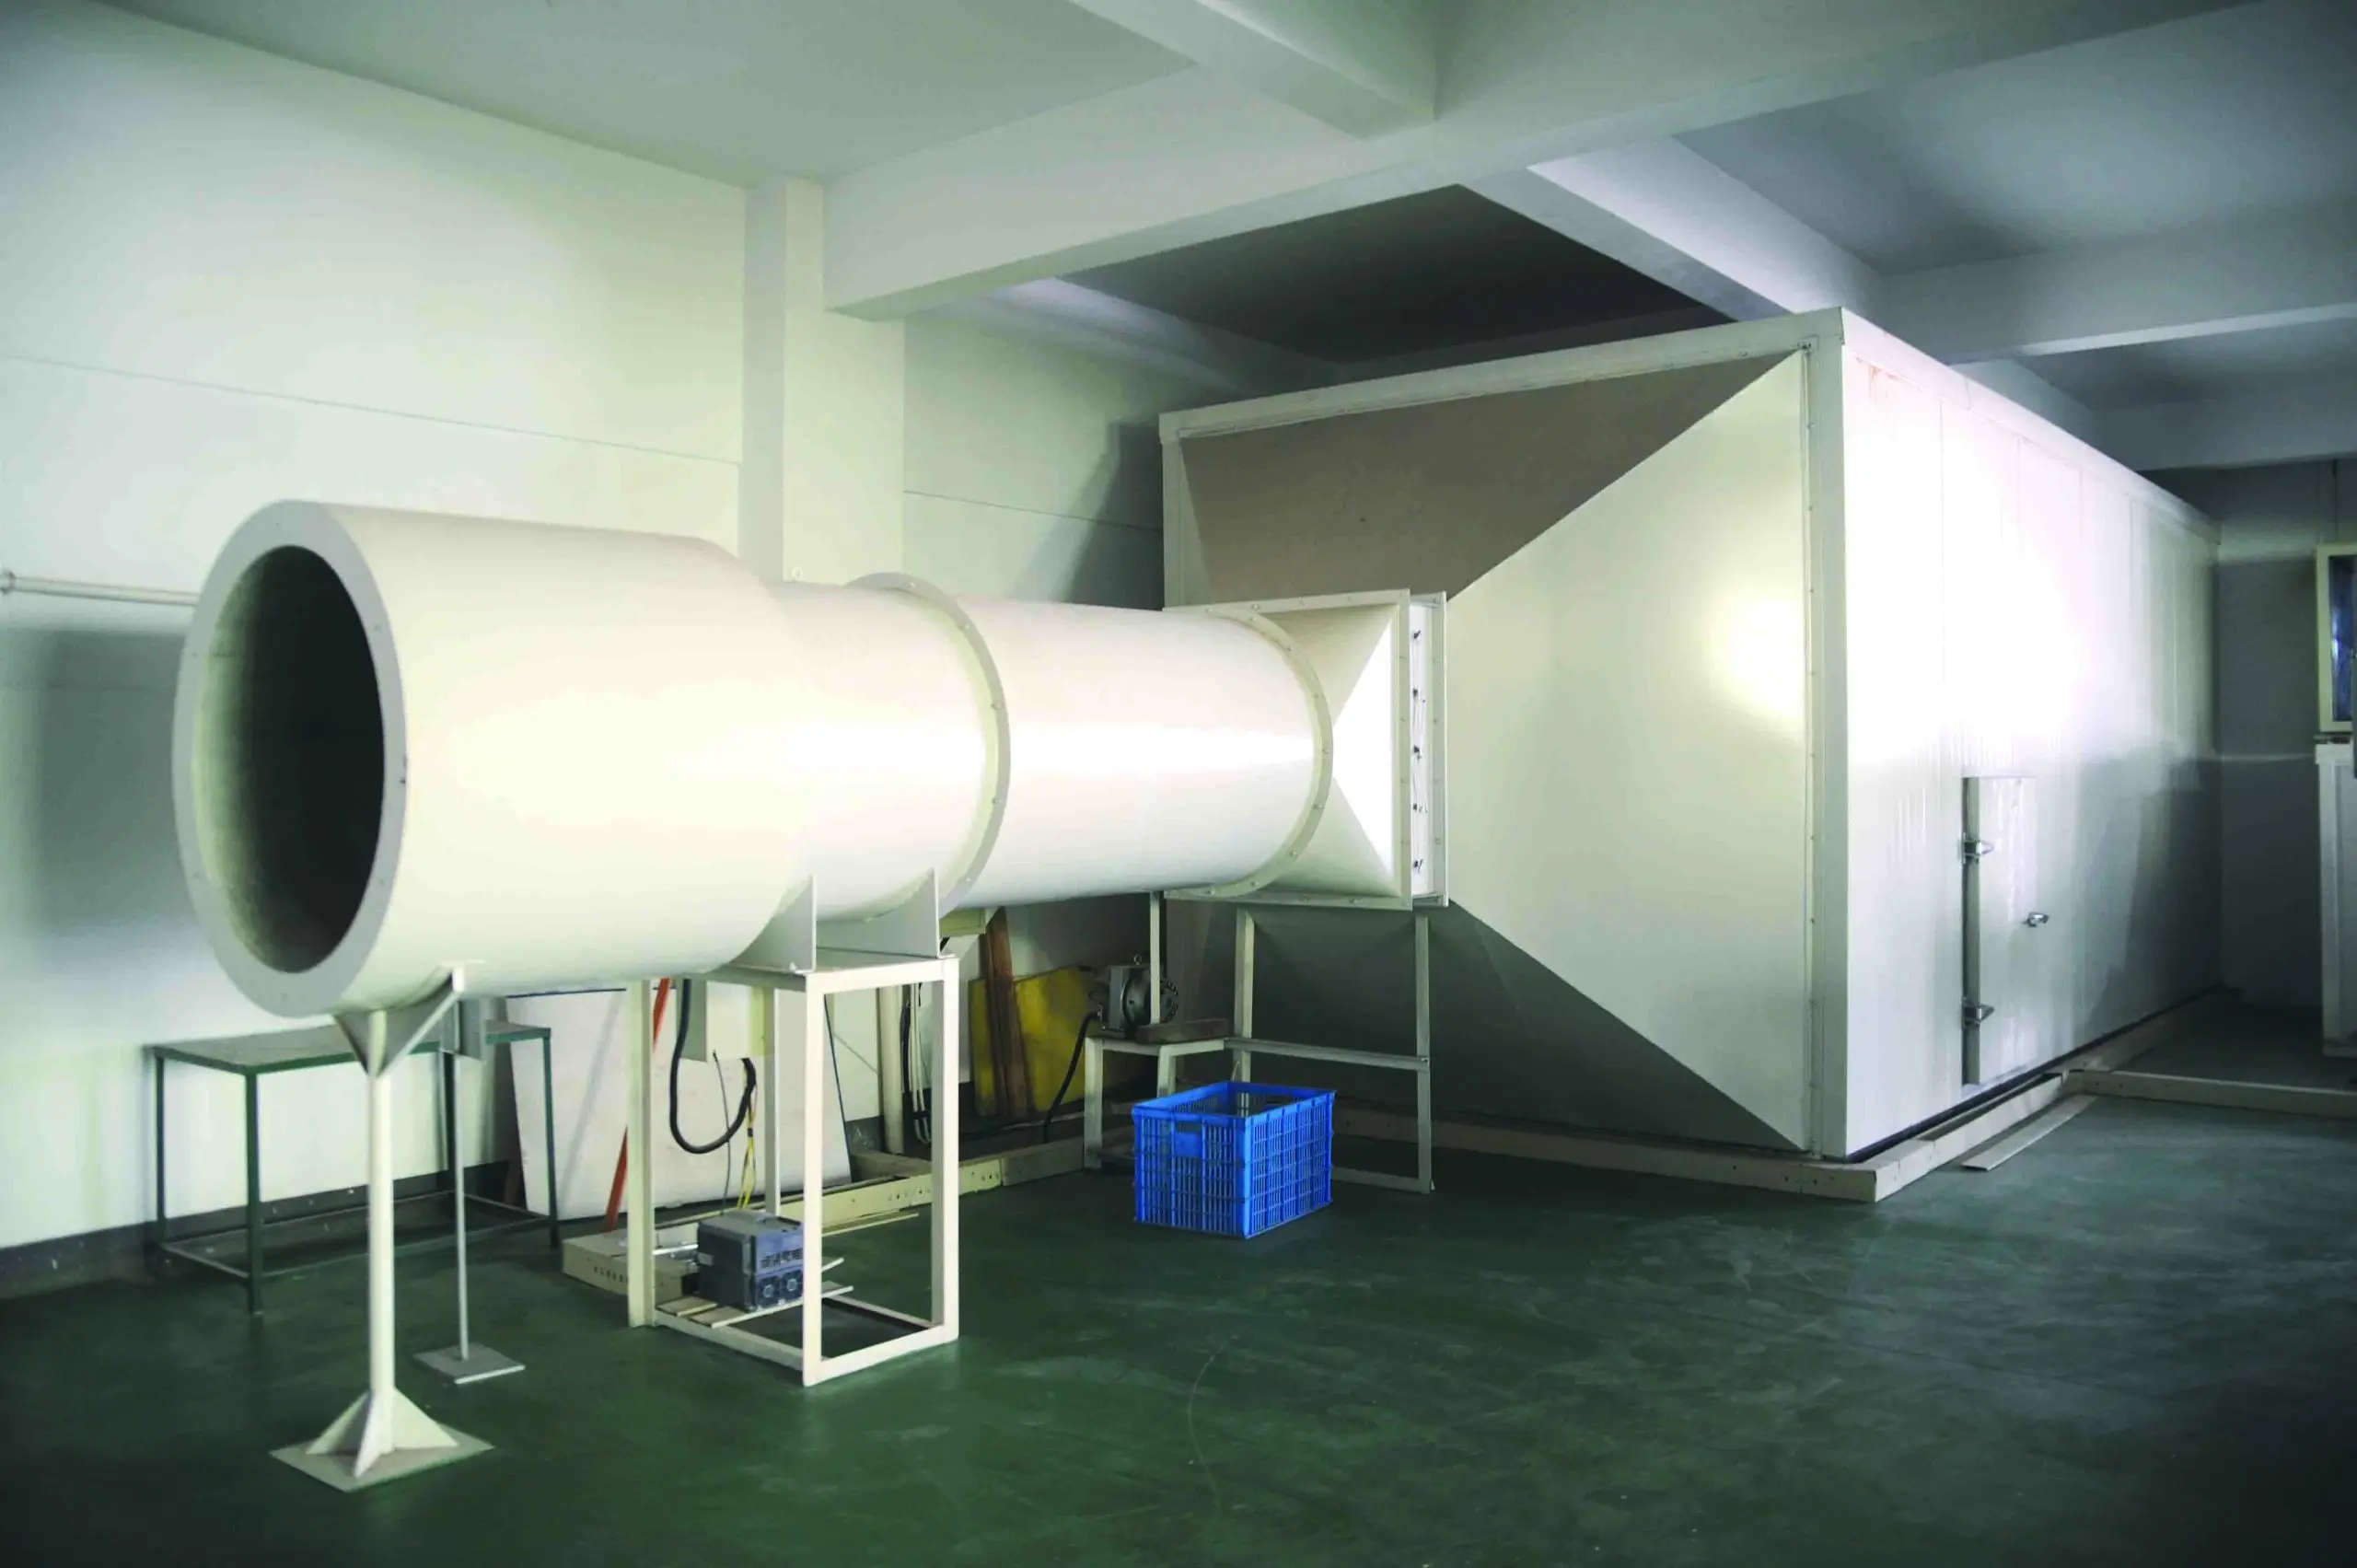
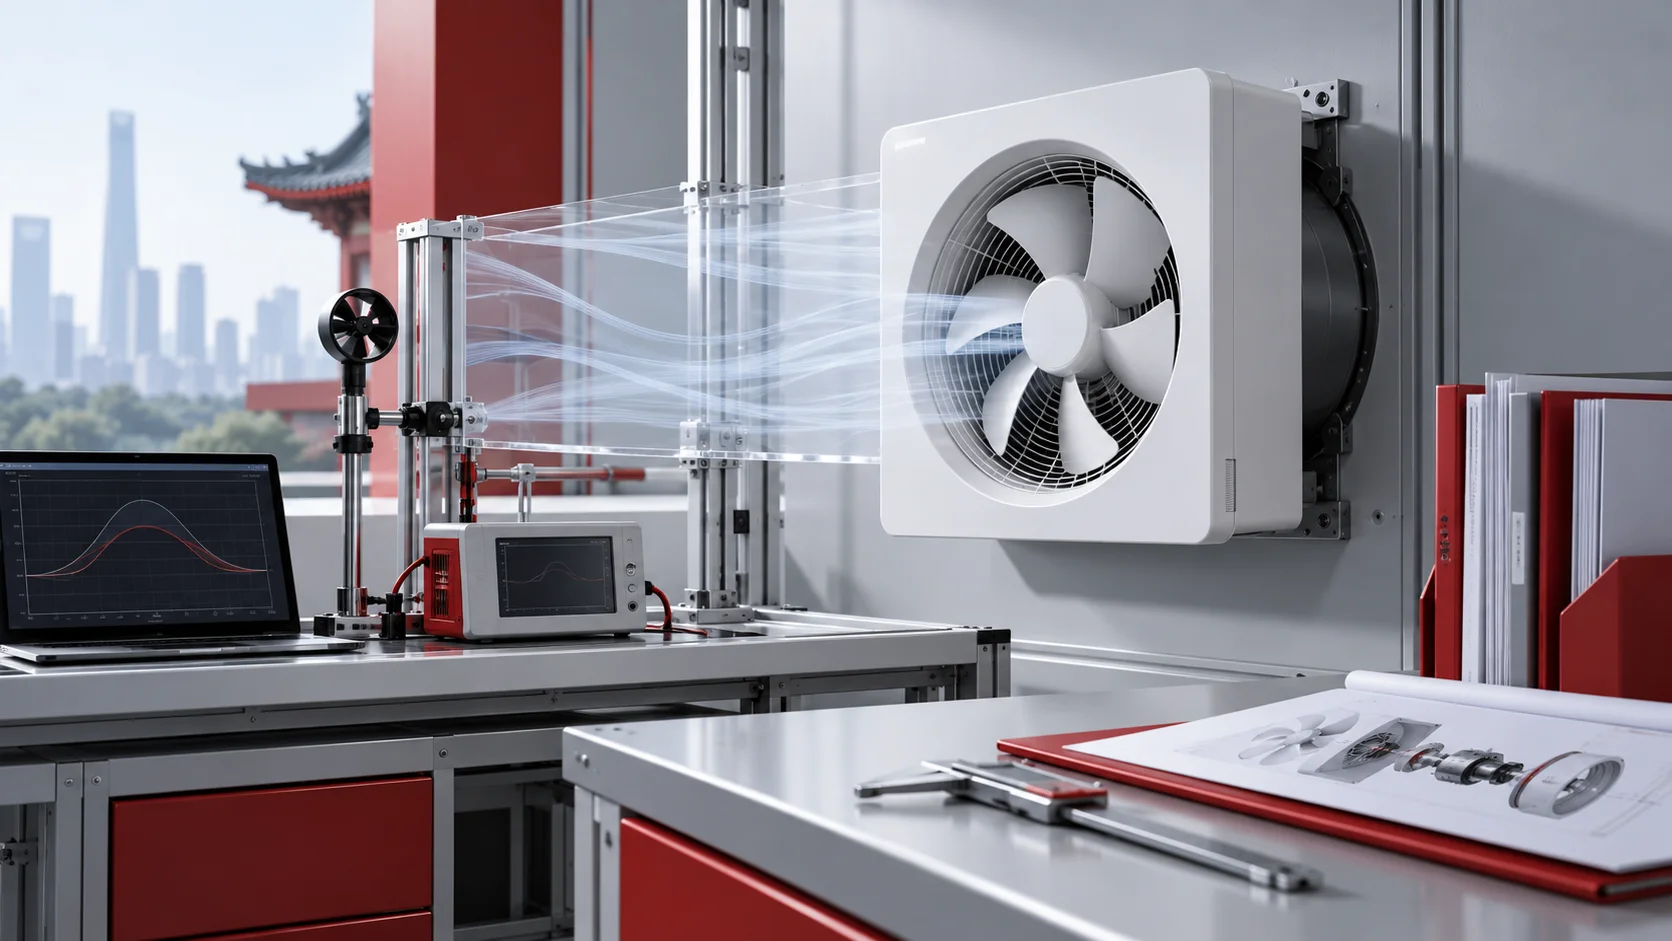
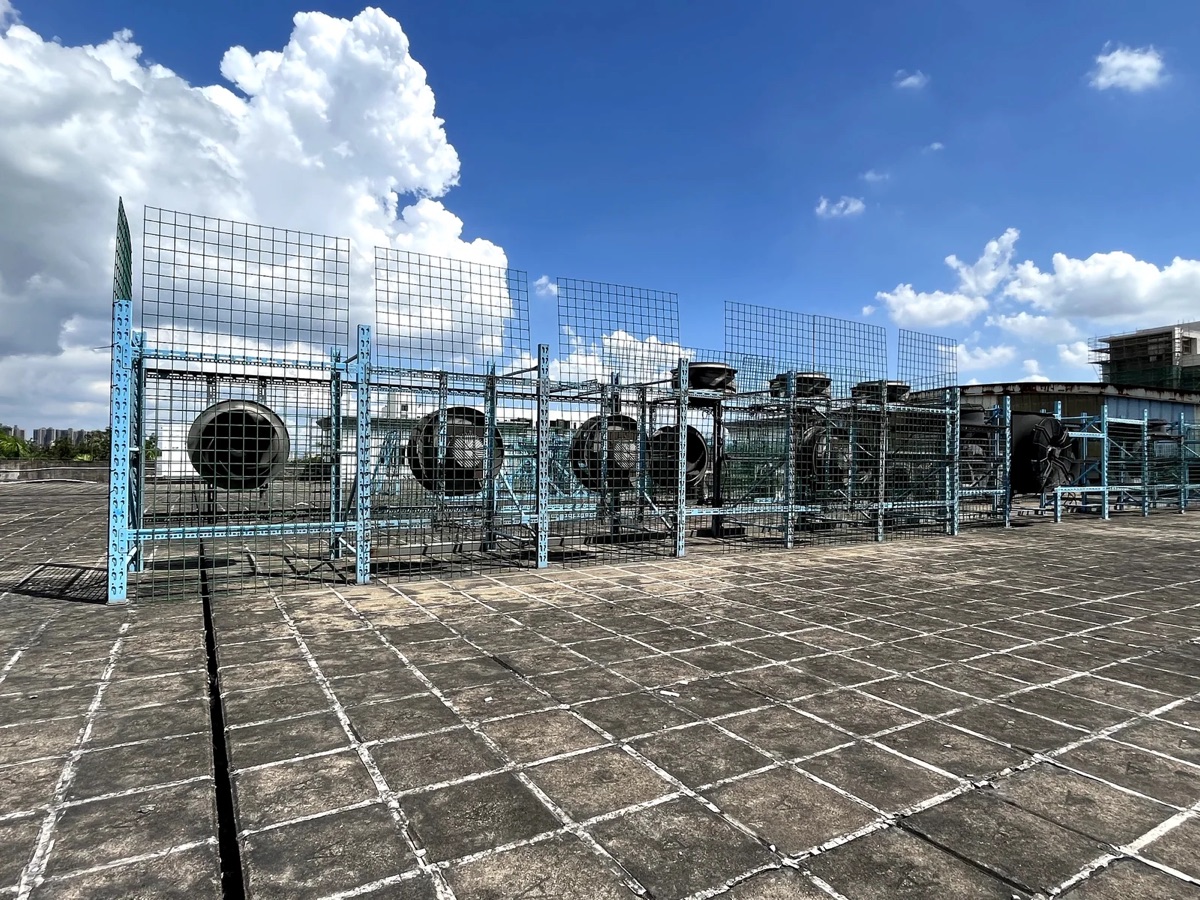
A laboratory curve belongs to a stated test arrangement. A tight inlet elbow, blocked intake, abrupt discharge, poor plenum, dirty filter, or downstream obstruction can move installed performance away from the catalogue expectation. The airflow test-room photograph above establishes only visible equipment context; it does not prove accreditation, a named standard, or a result for a particular model.
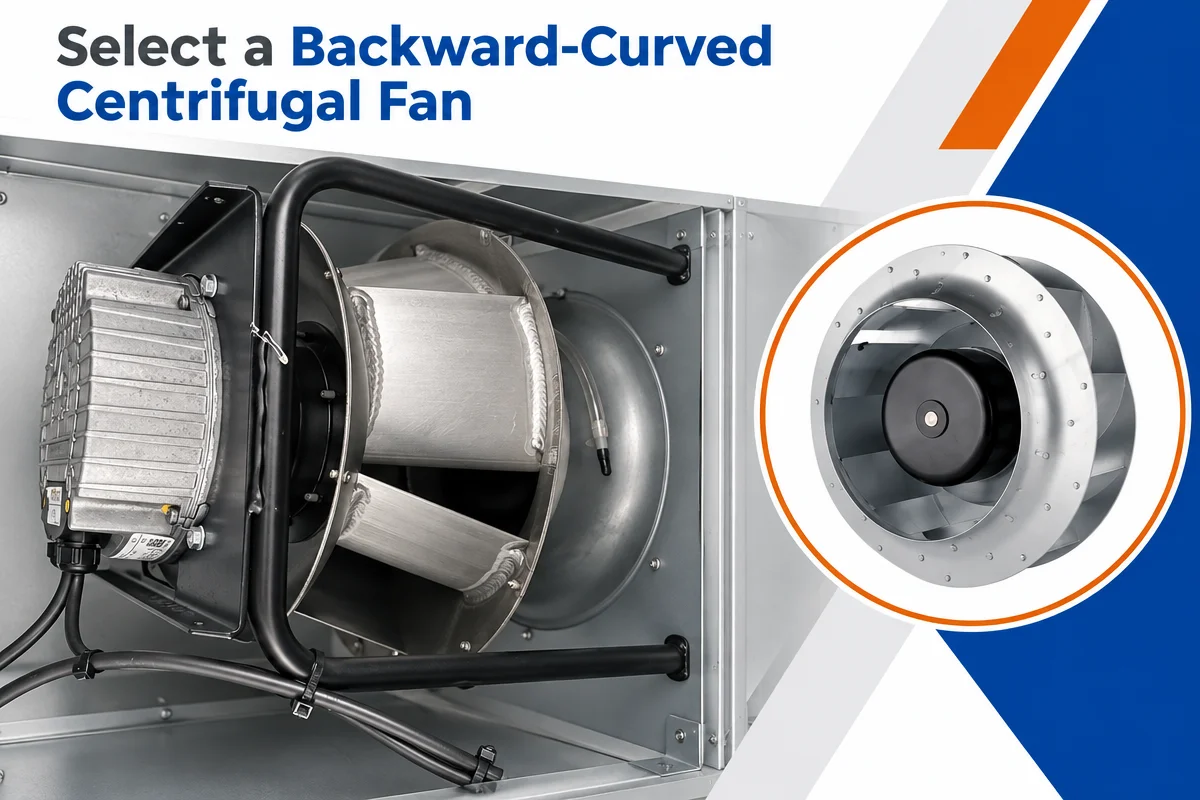
A practical workflow is to define airflow, pressure, density, and worst-case resistance; calculate the system curves; overlay candidate fan and speed curves; read pressure, power, efficiency, sound, and limits at every important intersection; and then verify mechanical, electrical, and control interfaces. The backward-curved centrifugal fan family and centrifugal blower family pages are useful discovery routes only after the duty and equipment boundary are defined.
For an RFQ, provide minimum, normal, and maximum airflow-pressure points; static or total pressure; temperature and density basis; filter states; supply and control signals; space and mounting constraints; and the required sound evidence. Ask the supplier to return the exact suffix and revision, controlled curve, drawing, test conditions, power data, operating limits, and tolerances.
Commission the installed equipment by measuring airflow or a validated proxy, pressure, electrical input, sound, vibration, and control response at agreed locations. The right fan is the one whose complete curve family meets every required operating point inside an allowable envelope—not the one with the largest maximum-flow number.
Choose the right centrifugal fan
Longwell manufactures 1,130 centrifugal fans in-house. Send airflow, static pressure and voltage — an engineer replies with a matching model, performance curve and price within one working day.