Key Takeaways
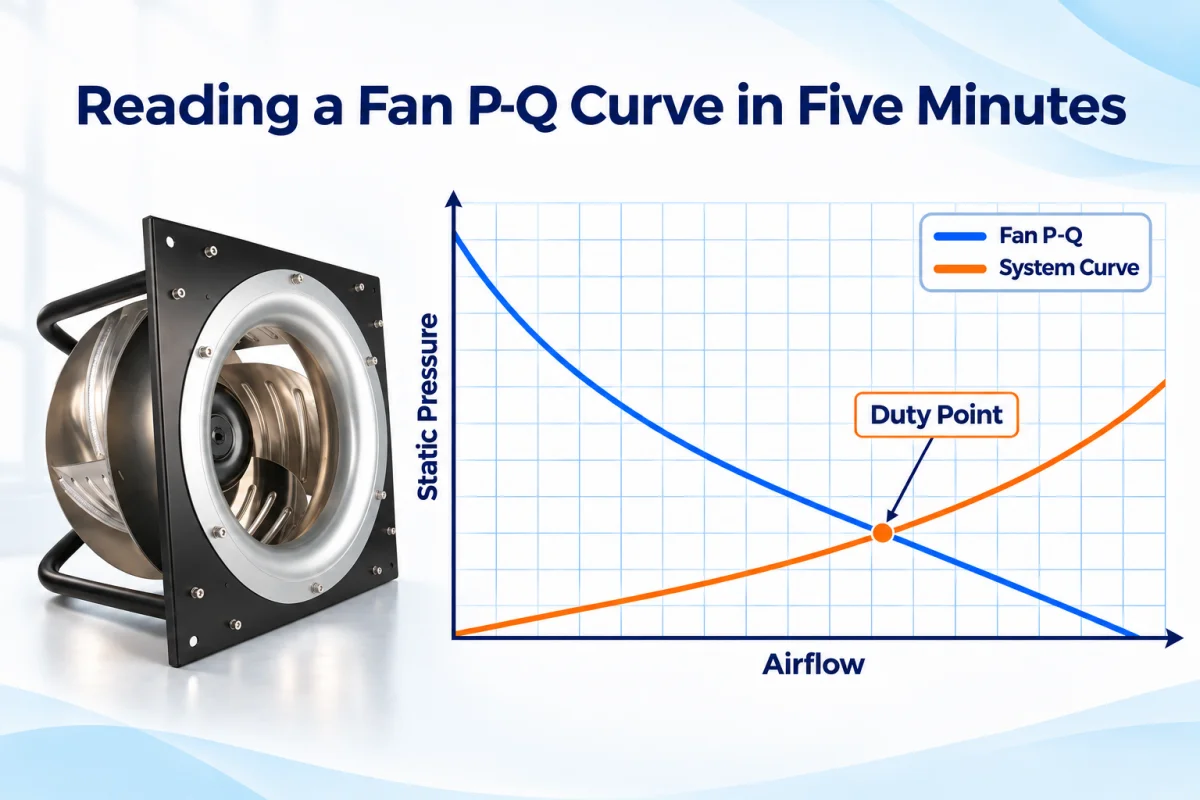
- A P-Q curve plots airflow (Q) against static pressure (P). The two always trade off: more restriction means less delivered air.
- The two headline numbers, maximum airflow and maximum static pressure, are endpoints measured at opposite extremes. They are never delivered at the same time.
- Real installed airflow is decided by the intersection of the fan curve and the system resistance curve.
- The fan’s best efficiency point and the actual duty point cannot coincide; keeping the duty point reasonably close to BEP is a separate selection check.
- Five-minute guide cover: axes and labels, read data in pairs, check pressure and airflow, compare with BEP, and check operating range.
A P-Q curve is a useful chart for matching a fan to a system. Q (airflow) is the volume of air the fan moves, typically in m³/h or CFM. P (static pressure) is the resistance the fan is pushing against, typically in Pa or mmH₂O. The two quantities are negatively related. The more restriction a fan faces, the less air it actually delivers. The airflow data alone without a corresponding pressure value is therefore insufficient to predict installed performance.
This blog will introduce a five-minute guide to read a fan’s P-Q curve and explain the reason of replacement fan fall short.
What Can Be Learned From a P-Q Curve?
The P-Q curve answers the questions that single datasheet numbers cannot. Delivered airflow at any resistance comes first: at every pressure along the axis, the curve states the airflow the fan will actually move, not the free-air maximum.
The slope of the curve carries the rate of the trade-off. It shows how quickly flow falls as resistance rises, which predicts how sensitive the installed airflow will be to a loading filter or a drifting damper. The shape of the curve also marks the stable operating region, showing how much margin a duty point has before instability. Overlaid with the system resistance curve, the P-Q curve finally predicts where the installed system will really perform.
A 5-Minute Guide to Read a Fan P-Q Curve
Minute 1: Check the Axes and Labels
Confirm what is plotted before reading the number. Airflow Q sits on the x-axis, static pressure P on the y-axis; check the units on both (m³/h or CFM, Pa, mmH₂O or inH₂O) and whether the pressure is static or total. If the chart shows several curves, read the legend: each line is usually one speed (RPM or PWM stage), and the lines together show how the fan behaves while airflow and pressure are changing. Then confirm the operating conditions behind the curve and its test boundary.
Minute 2: Understand the Data in Pairs
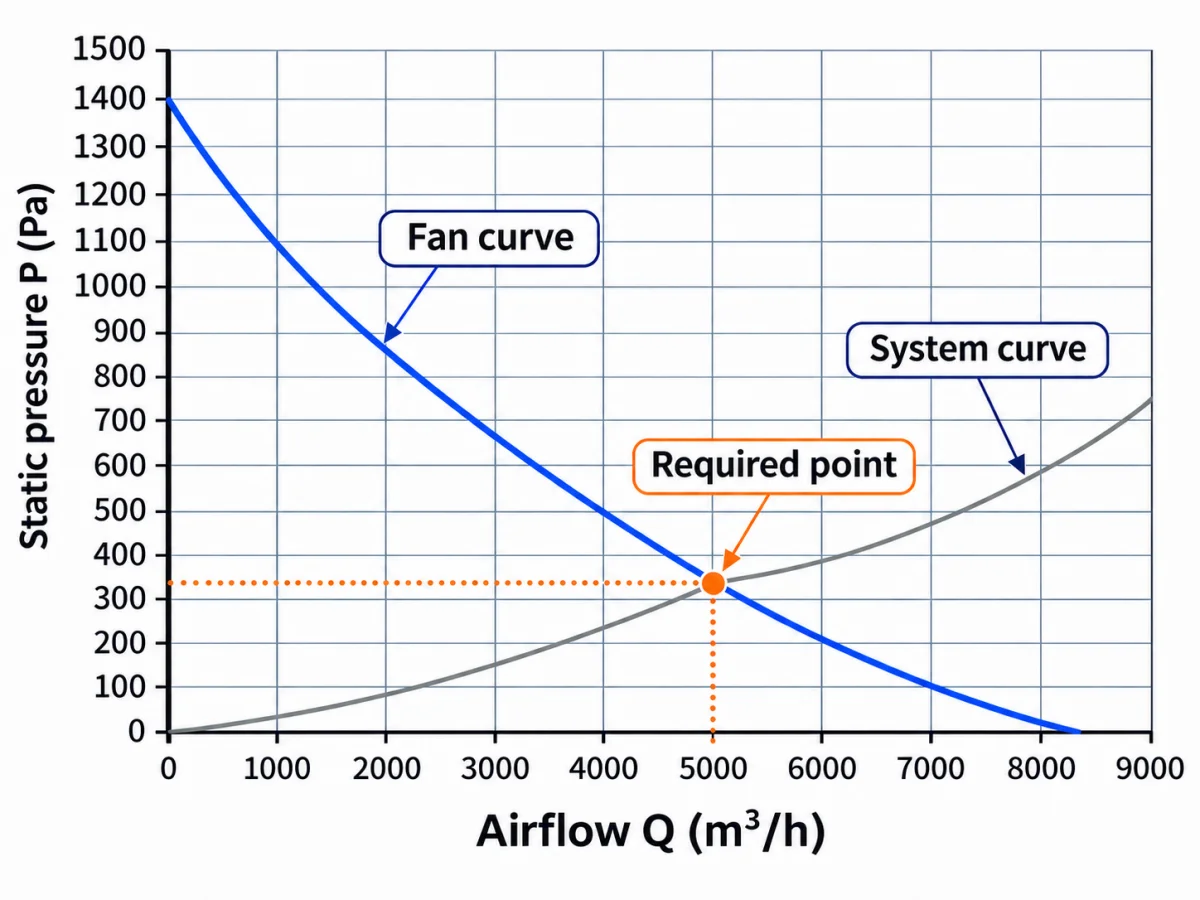
Before touching the fan curve, write down your data pairs: the airflow the system needs and the external static pressure it must overcome at that airflow. Both numbers appear at the same time. Then mark that point on the chart. It is the required point, one coordinate pair, not two parameters.
Be careful what goes into the pair. Use external static pressure that includes filters, coils, dampers, and ductwork, and record it at two states: clean filter and loaded filter. A required point that ignores filter loading only exists on the day of commissioning.
Minute 3: Check the Fan’s Pressure at the Required Airflow
With the point marked, the curve is read at the required airflow. Q is located on the x-axis; the reading moves up to the curve, and the available static pressure is taken from the y-axis. If available pressure meets or exceeds the required pressure at that airflow rate, the point sits on or under the curve. If it falls short, the fan cannot deliver that flow against that resistance.
The slope where the two values also implies information. A steep curve holds its airflow when system pressure drifts; a flat curve swings airflow widely for the same pressure change. Two same-sized fans can cover the same point on paper and still behave differently once installed.
Minute 4: Comparison with BEP
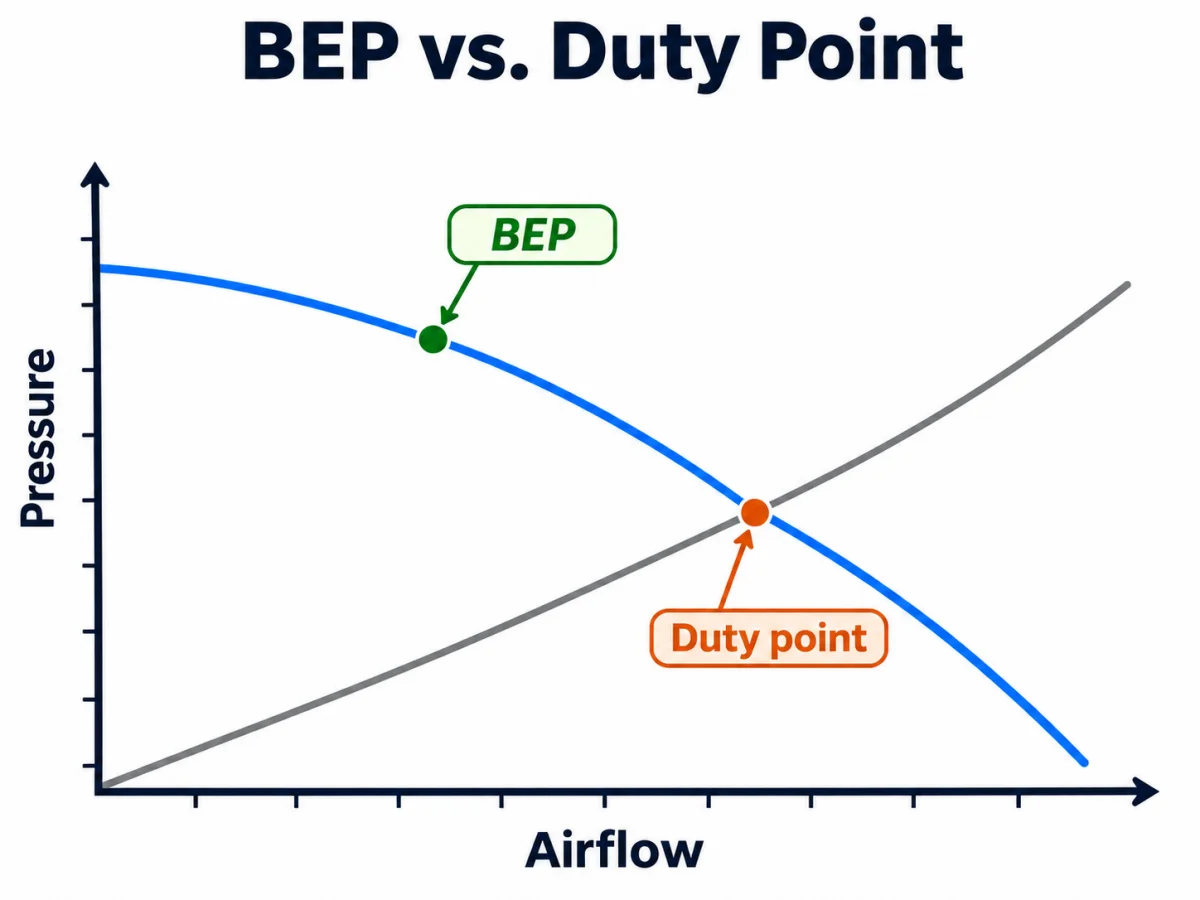
The best efficiency point (BEP is another important point. It is the fan’s own optimum: the airflow at which the fan converts input power into air movement most efficiently. It is fixed by the fan’s own aerodynamic design. The duty point is fixed by where the system resistance curve crosses the fan curve. The two are set by different things, so unless the system resistance happens to pass exactly through BEP, the fan always operates somewhat away from its best efficiency.
However, operating far from BEP has a measurable cost: efficiency falls, so the same airflow draws more power, while recirculation, vibration, and noise all rise. A common selection practice keeps the duty point reasonably close to BEP, often cited as within roughly ±20% of the BEP airflow.
Minute 5: Check the Operating Range
The actual operating point in the system is a moving target. In practical operating conditions, the filter loading steepens the system curve. The duty point will therefore slide left along the fan’s P-Q curve. The key focus is not where the point sits at commissioning, but whether it stays in an optimal region across the whole curve.
| Zone | Location on curve | What it means for selection |
| Surge/stall zone | Left steep section, near shut-off | Flow oscillation, noise, vibration; no duty point belongs here, at any speed |
| Recommended / optimal operating zone | Middle region, right of the knee, the bend where the curve turns flat | Stable, efficient operation close to BEP; the duty point belongs here, with margin for filter loading and turndown |
| Free delivery / high-flow zone | Right end, near zero static pressure | Maximum flow against almost no resistance; rarely a usable operating region, and the source of the most-misused datasheet number |
Consider Airflow and Static Pressure Together
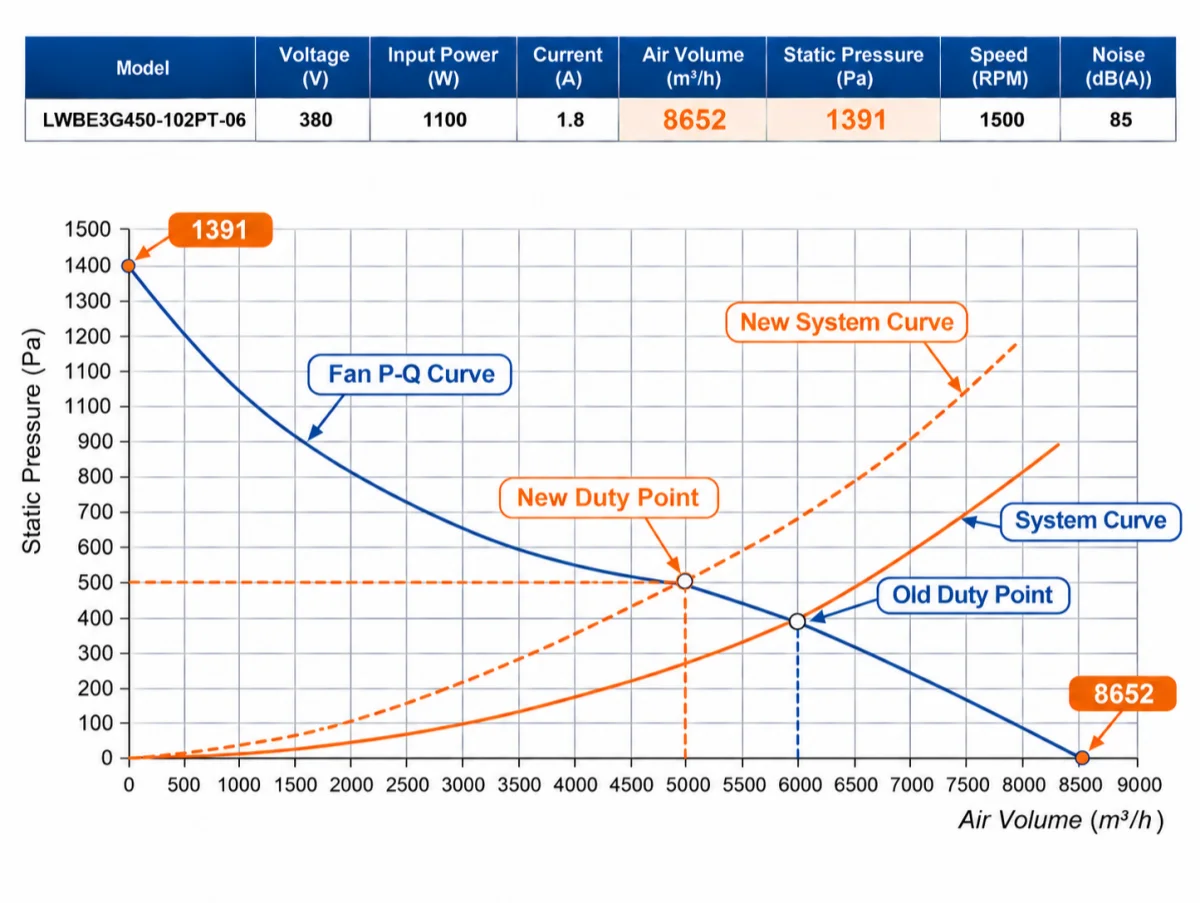
Open any catalog, and the two most prominent figures are maximum airflow and maximum static pressure. It is easy to treat them as two independent specifications and pick a fan that scores well on both. Take one 450mm impeller backward-curved centrifugal fan as an example; the maximum airflow of 8652 m³/h is measured at zero static pressure. The maximum static pressure of 1391 Pa is measured at zero airflow. This fan cannot deliver both at the same time.
As soon as the fan is connected to the system, system components such as filters, coils, and ducting will give the fan a basic system resistance. Plot the system resistance curve and the fan’s P-Q curve together. The intersection point becomes the fan’s duty point. This system resistance will increase along with the working time, which results in the duty point changing. A single number in the catalog therefore describes a condition the fan will never actually occupy.
This is exactly why the P-Q curve matters in selection: it is the only datasheet element that shows what the fan delivers at specific pressure, not at an idealized extreme.
Why Same-Size Replacement Fans Can Fall Short?
Impeller width, blade count, blade angle, and motor efficiency all contribute to the curve. Two same-sized fans can share the same impeller size but perform differently in systems.
- Slope sensitivity. Between two candidates, the steeper curve near the duty point holds airflow better when system resistance drifts, whether from filter loading or a damper moving. The flatter candidate converts the same drift into a larger airflow swing.
- Stall margin. The comparison looks at how far each candidate’s point sits from the knee at minimum speed with a loaded filter, not at design speed. The candidate with more margin absorbs more loading before its point destabilizes.
A single curve at one point cannot demonstrate any of this; demand the full curve family with speed lines from each supplier.
LONGWELL Fan Selector with P-Q Curve
The same duty-point logic runs in the LONGWELL fan selector. The tool holds 3,130 models with 849 P-Q curves and 2,863 dimensional drawings, covering impeller sizes from 20 to 2,038 mm and airflow up to 79,000 m³/h.
The duty-point selection follows the logic of this blog. Airflow and static pressure are entered as one pair, and the selector returns the P-Q curves of the qualifying models together with a ranking of every matching model, ordered from the best fit to the least suitable. The ranking table reflects how well each curve covers the point, in terms of pressure margin and speed reserve.
Beyond standard models, LONGWELL offers OEM and ODM customization with a 90-day new product introduction cycle. From new spec lock to mass production, the whole process can be completed in 90 days.
FAQ
Can a published curve be trusted?
The test boundary and standard of the curve should be requested. With declared conditions, published curves are legitimate screening tools, with verification at commissioning.
What if only free-air CFM is published?
The full curve or measured duty-point data at the required static pressure should be requested. Interpolation between free-air and shut-off points should be avoided; the knee and stall region make it unreliable.
How do altitude and temperature shift the curve?
Higher altitude or higher temperature lowers air density, shifting the pressure and power curves downward while leaving the airflow rate (CFM or m³/h) unchanged. The density correction is applied to the duty point and the curve.
Does a replacement need an identical curve shape?
It depends on what is being replaced. For a whole-fan cross-reference, the answer is no. The criteria are duty-point coverage with margin, the same curve family, and a verified control interface, not a copy of another model’s curve. The rule is stricter when fan blades or impellers themselves are replaced.